


Business Process Model and Notation (BPMN) is a standardized graphical notation used to represent business processes in a workflow. Visual Paradigm is a robust software tool that supports BPMN 2.0, enabling users to create professional and intuitive business process diagrams efficiently. This guide will walk you through the key features of Visual Paradigm, its usage scenarios, and provide examples to help you get started.
Key Features of Visual Paradigm BPMN Tool
1. Intuitive BPMN 2.0 Modeler Visual Paradigm provides an easy-to-use drag-and-drop BPMN editor that allows rapid creation of business process diagrams (BPDs). Users can manage complexity by expanding or collapsing subprocesses to show or hide lower-level process details, making it easier to focus on specific parts of a workflow.
Example:
- Create a high-level process diagram showing the main steps of an order fulfillment process.
- Expand a subprocess to detail the steps involved in “Process Payment.”
2. Comprehensive Modeling Support Besides BPMN, Visual Paradigm supports multiple modeling notations such as UML and ERD, allowing integration of different diagram types within a single project. This helps in mapping process flows alongside other modeling artifacts like system designs or data models for a holistic view.
Example:
- Integrate a BPMN diagram with a UML class diagram to show how business processes interact with system components.
3. Process Animation and Simulation The tool can animate process flows to visualize execution dynamically, which helps stakeholders understand process behavior beyond static diagrams. Additionally, it supports process simulation to analyze resource consumption, identify bottlenecks, estimate costs, and test improvement options before implementation.
Example:
- Animate the order fulfillment process to show the flow from order placement to delivery.
- Simulate the process to identify bottlenecks in the “Warehouse Picking” step.
4. Process Improvement and Traceability Visual Paradigm supports “As-is” and “To-be” process modeling, enabling users to document current workflows and design improved versions. Traceability features allow smooth navigation between baseline and target models, facilitating process re-engineering efforts.
Example:
- Document the current “As-is” order fulfillment process.
- Design a “To-be” process that includes automated payment processing and real-time inventory updates.
5. Responsibility and Data Management Charts It can automatically generate RACI charts (Responsible, Accountable, Consulted, Informed) and CRUD charts (Create, Read, Update, Delete) from BPMN diagrams. These charts clarify roles and data interactions within processes, enhancing communication and accountability.
Example:
- Generate a RACI chart for the order fulfillment process to clarify roles and responsibilities.
- Create a CRUD chart to show how data is managed throughout the process.
6. Collaboration and Integration Visual Paradigm offers real-time collaboration features, allowing teams to work together on BPMN diagrams online. It integrates with Microsoft Office documents and supports importing Visio files, enabling seamless workflow integration.
Example:
- Collaborate in real-time with team members to refine the order fulfillment process diagram.
- Import a Visio diagram of the current process to start the modeling effort.
7. Reporting and Documentation Users can produce detailed process specifications combining diagrams and working procedures, which serve as guidelines for teams. The tool also supports generating reports for process analysis, compliance, and training purposes.
Example:
- Generate a process specification document for the order fulfillment process, including diagrams and step-by-step procedures.
- Create a compliance report to ensure the process meets regulatory requirements.
8. Glossary and Resource Management The software includes glossary management to maintain consistent terminology across models and a resource catalog to plan and allocate resources effectively within business processes.
Example:
- Maintain a glossary of terms used in the order fulfillment process to ensure consistency.
- Use the resource catalog to allocate staff and equipment to different process steps.
BPMN Elements and Structure in Visual Paradigm
Visual Paradigm supports the full range of BPMN elements, including flow objects (events, activities, gateways), swimlanes (pools and lanes), and artifacts (data objects, data stores, groups). Pools represent participants or entities in a process, while lanes subdivide pools to organize activities by roles or departments.
Example:
- Create a pool for the “Order Fulfillment” process.
- Use lanes to organize activities by roles such as “Customer,” “Sales,” “Warehouse,” and “Shipping.”
Usage Scenarios
- Business Analysts and Process Designers: Use Visual Paradigm to document and improve workflows.
- Development Teams: Benefit from clear, standardized process models that align business and technical requirements.
- Organizations: Simulate processes to optimize resource use and reduce operational costs.
- Teams: Collaborate in real-time, ensuring alignment and faster decision-making.
BPMN Elements and Structure in Visual Paradigm
Visual Paradigm supports the full range of BPMN elements, which are essential for creating detailed and accurate business process diagrams. These elements include flow objects, swimlanes, and artifacts. Flow objects are the core components of a BPMN diagram and consist of events, activities, and gateways. Events represent something that happens during the course of a process, such as the start, intermediate, or end of a process. Activities depict the work being done within a process and can be further broken down into tasks and subprocesses. Gateways are used to control the flow of the process, determining branching, merging, and other types of flow control.
Swimlanes, which include pools and lanes, are used to organize and categorize activities within a process. Pools represent the participants or entities involved in the process, such as different departments or external organizations. Lanes subdivide pools to organize activities by roles or functions, providing a clear visual representation of who is responsible for each part of the process.
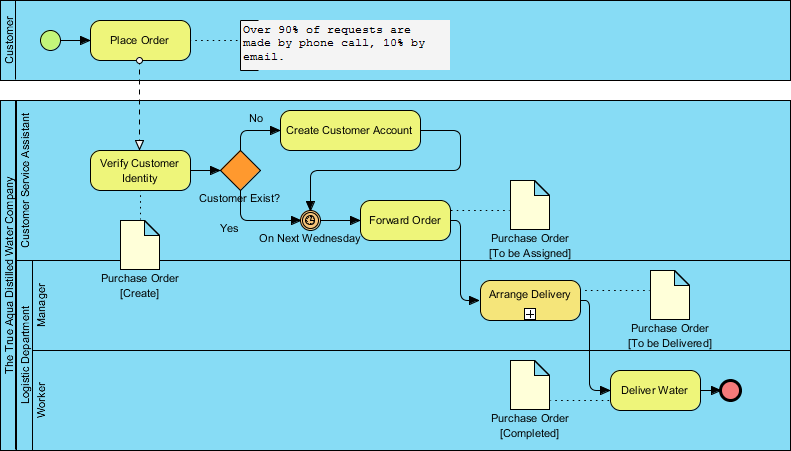
Artifacts are additional elements that provide more context and information to the process diagram. These include data objects, data stores, and groups. Data objects represent the information used or produced by activities, while data stores indicate where data is stored. Groups are used to visually organize related elements within the diagram, making it easier to understand complex processes.
By utilizing these BPMN elements, Visual Paradigm enables users to create comprehensive and precise business process diagrams that effectively communicate workflows and facilitate process analysis and improvement.

| Element Category | Element Type | Description | Symbol Shape |
|---|---|---|---|
| Flow Objects | Events | Represent something that happens during the process, such as start, intermediate, or end events. | Circle |
| Activities | Tasks or subprocesses performed in the process. Includes user tasks, service tasks, script tasks, subprocesses, transactions, and call activities. | Rounded rectangle | |
| Gateways | Control process flow by branching, merging, or synchronizing paths based on conditions. Types include exclusive, parallel, and inclusive gateways. | Diamond | |
| Connecting Objects | Sequence Flow | Shows the order of activities or events in the process flow. | Solid arrow |
| Message Flow | Represents communication between different participants or processes. | Dashed arrow | |
| Association | Links artifacts (such as data objects or annotations) to flow objects to provide additional information. | Dotted line | |
| Swimlanes | Pool | Represents a major participant or entity in a process, often an organization. | Large rectangle (container) |
| Lane | Subdivides pools to organize activities by roles, departments, or functions. | Horizontal or vertical bands | |
| Artifacts | Data Object | Represents data required or produced by activities. | Document-shaped icon |
| Group | Visually groups related activities without affecting flow. | Rounded rectangle with dashed border | |
| Text Annotation | Adds descriptive text or comments to clarify parts of the diagram. | Bracket or note symbol |
Additional Notes:
-
Events can be further specialized (e.g., start event triggered by message or timer, intermediate events representing delays or messages, end events signaling process completion).
-
Activities can be atomic tasks or complex subprocesses, including reusable call activities or transactional subprocesses.
-
Gateways determine decision points and parallelism in the process flow.
-
Swimlanes clarify responsibilities and process ownership.
-
Artifacts provide context and additional information without changing process flow.
This classification aligns with BPMN 2.0 standards and is widely used in BPMN modeling tools such as Visual Paradigm, Camunda, and others12345.
Summary
Visual Paradigm’s BPMN tool is a powerful, user-friendly solution for business process modeling. Its support for detailed BPMN 2.0 diagrams, subprocess management, process simulation, role and data responsibility charts, collaboration, and reporting makes it ideal for organizations aiming to understand, communicate, and improve their business processes effectively.
In essence, Visual Paradigm enables businesses to visualize workflows clearly, analyze performance, and implement improvements with confidence, bridging the gap between business analysis and operational execution.
Example: Order Fulfillment Process
Step 1: Create a New BPMN Diagram
- Open Visual Paradigm and create a new BPMN diagram.
- Name the diagram “Order Fulfillment Process.”
Step 2: Define Pools and Lanes
- Create a pool named “Order Fulfillment.”
- Add lanes for “Customer,” “Sales,” “Warehouse,” and “Shipping.”
Step 3: Add Flow Objects
- Events: Start with a “Start Event” for “Order Placed.”
- Activities: Add activities such as “Process Payment,” “Pick Items,” “Pack Items,” and “Ship Order.”
- Gateways: Use an “Exclusive Gateway” to handle different payment methods.
Step 4: Connect Flow Objects
- Connect the “Start Event” to the “Process Payment” activity.
- Connect “Process Payment” to the “Exclusive Gateway.”
- Connect the gateway to “Pick Items,” “Pack Items,” and “Ship Order” activities.
Step 5: Add Artifacts
- Add data objects such as “Order Details,” “Payment Information,” and “Shipping Label.”
- Connect these data objects to the relevant activities.
Step 6: Simulate the Process
- Use the process simulation feature to animate the flow and identify bottlenecks.
- Analyze the simulation results to optimize the process.
Step 7: Generate Reports
- Generate a process specification document and a RACI chart.
- Use the reports to communicate the process to stakeholders and train team members.
By following these steps, you can create a comprehensive and effective business process model using Visual Paradigm.
Case Study: Streamlining Order Fulfillment with Visual Paradigm BPMN
Background
XYZ Corporation, a leading e-commerce company, faced significant challenges in its order fulfillment process. The existing workflow was inefficient, leading to delays, increased operational costs, and customer dissatisfaction. The company needed a comprehensive solution to document, analyze, and improve its business processes.
Objective
The primary objective was to streamline the order fulfillment process to enhance efficiency, reduce costs, and improve customer satisfaction. XYZ Corporation aimed to achieve this by leveraging Visual Paradigm’s BPMN tool to model, simulate, and optimize their workflows.
Implementation
Step 1: Process Documentation
The first step involved documenting the current “As-is” order fulfillment process. Using Visual Paradigm’s intuitive BPMN 2.0 modeler, the business analysts created a detailed diagram of the existing workflow. This included identifying all key activities, events, gateways, and swimlanes.
- Activities: Order Placement, Payment Processing, Warehouse Picking, Packing, Shipping
- Events: Order Received, Payment Confirmed, Order Shipped
- Gateways: Decision points for payment verification and inventory availability
- Swimlanes: Customer, Sales, Warehouse, Shipping
Step 2: Process Analysis
With the “As-is” process documented, the team used Visual Paradigm’s process simulation feature to analyze the current workflow. The simulation revealed several bottlenecks, particularly in the “Warehouse Picking” and “Payment Processing” stages. These bottlenecks were causing delays and increasing operational costs.
Step 3: Process Improvement
Based on the analysis, the team designed a “To-be” process that addressed the identified bottlenecks. The improved process included:
- Automated Payment Processing: Implementing an automated payment verification system to reduce manual intervention and speed up the process.
- Real-time Inventory Updates: Integrating the warehouse management system with real-time inventory updates to ensure accurate stock levels and reduce picking errors.
- Parallel Processing: Introducing parallel processing for packing and shipping to expedite order fulfillment.
Step 4: Collaboration and Integration
Visual Paradigm’s collaboration features allowed the team to work together in real-time, ensuring that all stakeholders were aligned and could provide input on the process improvements. The tool’s integration with Microsoft Office and Visio enabled seamless workflow integration, making it easier to incorporate existing documentation and diagrams.
Step 5: Reporting and Documentation
The team generated detailed process specifications and reports using Visual Paradigm. These documents included:
- Process Specification Document: A comprehensive guide outlining the new order fulfillment process, including diagrams and step-by-step procedures.
- RACI Chart: A responsibility assignment matrix clarifying roles and responsibilities for each activity in the process.
- CRUD Chart: A chart detailing the data interactions within the process, ensuring data integrity and accountability.
Step 6: Training and Implementation
The final step involved training the staff on the new process and implementing the changes. The detailed documentation and reports generated by Visual Paradigm served as valuable training materials, ensuring that all team members understood the new workflow and their roles within it.
Results
The implementation of the improved order fulfillment process using Visual Paradigm’s BPMN tool yielded significant benefits for XYZ Corporation:
- Reduced Processing Time: The automated payment processing and real-time inventory updates reduced the order fulfillment time by 30%.
- Cost Savings: The streamlined process resulted in a 20% reduction in operational costs.
- Improved Customer Satisfaction: Faster order fulfillment and fewer errors led to a 25% increase in customer satisfaction scores.
- Enhanced Collaboration: The real-time collaboration features of Visual Paradigm improved team communication and alignment, leading to faster decision-making and implementation.
By leveraging Visual Paradigm’s BPMN tool, XYZ Corporation successfully streamlined its order fulfillment process, achieving significant improvements in efficiency, cost savings, and customer satisfaction. The comprehensive modeling, simulation, and reporting capabilities of Visual Paradigm enabled the company to document, analyze, and optimize its workflows effectively. This case study demonstrates the power of Visual Paradigm in transforming business processes and driving operational excellence.
Conclusion
Visual Paradigm stands out as a comprehensive and versatile tool for business process modeling, offering a wide array of features that cater to various aspects of BPMN 2.0. Its intuitive drag-and-drop interface, combined with robust modeling support, makes it accessible for both beginners and experienced professionals. The ability to animate and simulate processes provides a dynamic understanding of workflows, while the “As-is” and “To-be” modeling capabilities facilitate continuous process improvement.
The tool’s collaboration and integration features ensure that teams can work together seamlessly, regardless of their physical location. The automatic generation of RACI and CRUD charts, along with detailed reporting and documentation capabilities, enhances communication and accountability within organizations. Additionally, the glossary and resource management features help maintain consistency and efficiency across all business processes.
By leveraging Visual Paradigm, organizations can bridge the gap between business analysis and operational execution, ensuring that their processes are not only well-documented but also optimized for performance and cost-effectiveness. Whether you are a business analyst, a process designer, or part of a development team, Visual Paradigm provides the tools necessary to visualize, analyze, and improve business processes with confidence.
In summary, Visual Paradigm is an invaluable asset for any organization looking to enhance its business process modeling capabilities, driving better decision-making, improved efficiency, and ultimately, greater success.
Reference
-
Visual Paradigm BPMN Diagram and Tools
-
Online Visual Paradigm BPMN Tool
-
How to Draw BPMN Diagram
-
What is BPMN?
-
Comprehensive Guide to Visual Paradigm for Business Process Modeling
-
BPMN Notation Overview
-
BPMN Tutorial with Example
-
BPM Modeling Solution
-
Sequence and Message Flow in BPMN
-
Visual Paradigm BPMN Tutorial Video