


State diagrams, or state machine diagrams, are a powerful component of the Unified Modeling Language (UML) used to model the dynamic behavior of systems. They illustrate how an object or system transitions between distinct states in response to events, making them ideal for reactive systems like a Bank Automated Teller Machine (ATM). This case study explores how a state diagram can represent the behavior of an ATM, a familiar real-world system with clear states and event-driven transitions. By examining the ATM’s lifecycle, we will highlight key state diagram concepts, including states, transitions, actions, composite states, and triggerless transitions. This case study also demonstrates how tools like Visual Paradigm can streamline the creation of such diagrams.
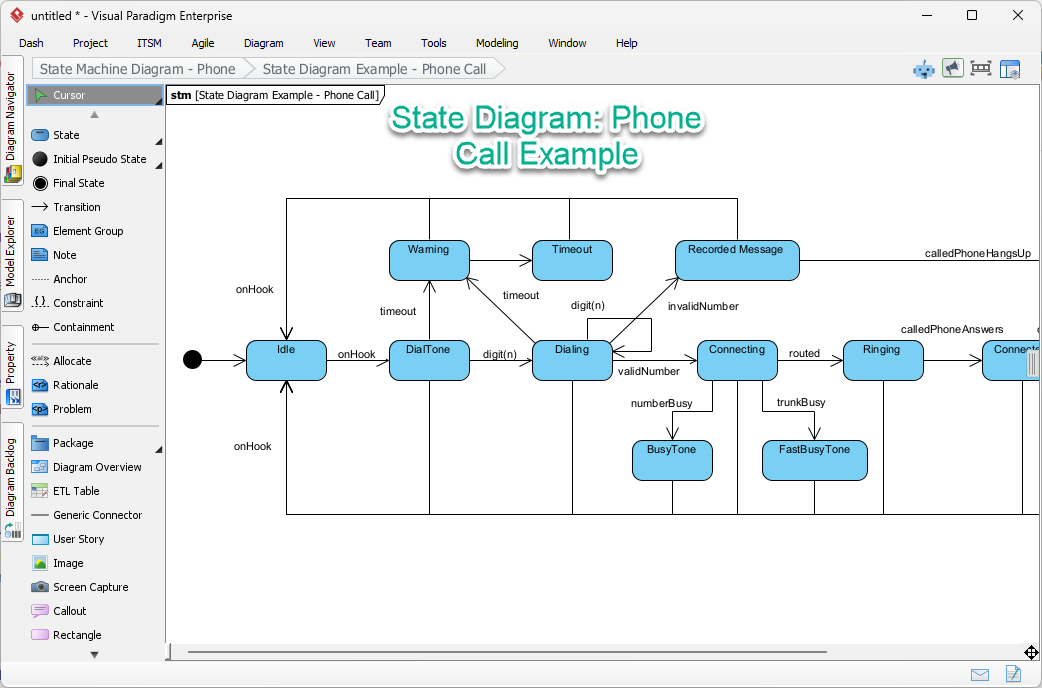
Below is a state machine diagram created with Visual Paradigm’s state machine diagram modeling editor:
Key Concepts of State Diagrams
State diagrams capture the behavior of a system by defining:
-
States: Specific conditions or situations during the system’s lifecycle (e.g., “Idle” or “Serving Customer”).
-
Transitions: Movements between states triggered by events (e.g., card insertion).
-
Actions: Activities performed when entering, exiting, or transitioning between states (e.g., reading a card).
-
Composite States: States containing sub-states for hierarchical modeling (e.g., “Serving Customer” with sub-states like “Customer Authentication”).
-
Initial and Final States: The starting and potential ending points of the system’s behavior.
-
Triggerless Transitions: Automatic transitions without explicit events (e.g., moving from a self-test to idle state).
These concepts are critical for modeling systems where behavior depends on the current state and external stimuli, such as an ATM.
Case Study: Bank ATM System
System Overview
A Bank ATM facilitates customer transactions like cash withdrawals, deposits, and balance inquiries. Its behavior is event-driven, with distinct states that change based on user actions (e.g., inserting a card, entering a PIN) or system conditions (e.g., passing a self-test). A state diagram is an effective tool to model this behavior because it clearly defines the ATM’s states, transitions, and actions, ensuring a structured representation for design, implementation, and maintenance.
States and Descriptions
The ATM operates in the following states:
-
Turned Off
-
Description: The ATM is powered off and cannot interact with users. This is the initial state before the system is activated.
-
Key Characteristics: No operations are possible until the ATM is powered on.
-
-
Self Test
-
Description: Upon power-on, the ATM enters this state to perform a diagnostic test, checking components like the card reader, keypad, and cash dispenser.
-
Outcomes:
-
Pass: The ATM transitions to the “Idle” state.
-
Fail: The ATM transitions to the “Out of Service” state.
-
-
Key Characteristics: This state ensures the ATM is operational before serving customers.
-
-
Out of Service
-
Description: Entered if the self-test fails or if a critical error occurs (e.g., cash dispenser malfunction). The ATM is non-operational and requires maintenance.
-
Key Characteristics: Acts as a final state until repaired or reset.
-
-
Idle
-
Description: The ATM is powered on, operational, and waiting for a customer to initiate a transaction by inserting a banking or credit card.
-
Key Characteristics: The primary waiting state for customer interaction.
-
-
Serving Customer
-
Description: A composite state entered when a customer inserts a card. It encompasses all customer interactions, from authentication to transaction completion.
-
Entry Action: readCard (the ATM reads the card’s details).
-
Exit Action: ejectCard (the ATM releases the card).
-
Sub-states:
-
Customer Authentication
-
The ATM prompts the customer to enter a PIN and validates it.
-
If the PIN is incorrect, the ATM may allow retries (e.g., up to three attempts) before ejecting the card.
-
-
Selecting Transaction
-
The customer selects a transaction type (e.g., withdrawal, deposit, balance inquiry).
-
-
Transaction
-
The ATM processes the selected transaction (e.g., dispensing cash, accepting a deposit, displaying the balance).
-
Upon completion, the ATM returns to the “Idle” state.
-
-
-
Transitions
The ATM transitions between states based on events or conditions. The key transitions are:
|
Transition |
From State |
To State |
Trigger |
Action |
|---|---|---|---|---|
|
Power On |
Turned Off |
Self Test |
ATM is powered on |
Perform startup (initialize hardware) |
|
Self Test Success |
Self Test |
Idle |
None (triggerless) |
None |
|
Self Test Failure |
Self Test |
Out of Service |
Test fails |
None |
|
Card Insertion |
Idle |
Serving Customer |
Customer inserts card |
readCard |
|
Authentication Success |
Customer Authentication |
Selecting Transaction |
Valid PIN entered |
None |
|
Authentication Failure (after retries) |
Customer Authentication |
Idle |
Invalid PIN (exceeds retries) |
ejectCard |
|
Transaction Selected |
Selecting Transaction |
Transaction |
Customer selects transaction |
None |
|
Transaction Complete |
Transaction |
Idle |
Transaction finishes |
ejectCard |
|
Cancel |
Any sub-state in Serving Customer |
Idle |
Customer cancels |
ejectCard |
Key Concepts Illustrated
This state diagram demonstrates several core concepts of state diagrams:
-
States: The ATM’s behavior is divided into distinct states (e.g., Turned Off, Idle, Serving Customer), each representing a specific condition.
-
Transitions: Events like card insertion or PIN validation trigger state changes, clearly defining the system’s flow.
-
Actions: Entry actions (e.g., readCard) and exit actions (e.g., ejectCard) specify activities during state changes.
-
Composite States: The “Serving Customer” state contains sub-states (Customer Authentication, Selecting Transaction, Transaction), enabling hierarchical modeling.
-
Initial and Final States: “Turned Off” is the initial state, while “Out of Service” acts as a final state until maintenance occurs.
-
Triggerless Transitions: The transition from “Self Test” to “Idle” occurs automatically if the test passes, without an explicit event.
Why Use a State Diagram for an ATM?
State diagrams are ideal for modeling an ATM because:
-
Finite States: The ATM has a clear set of states (e.g., Idle, Serving Customer) that define its behavior.
-
Event-Driven Behavior: Transitions are triggered by user actions (e.g., card insertion, PIN entry) or system conditions (e.g., self-test results).
-
Hierarchical Structure: Composite states like “Serving Customer” allow detailed modeling of complex interactions.
-
Clarity for Stakeholders: The diagram provides a visual representation that developers, designers, and stakeholders can easily understand, aiding in system design and maintenance.
Using Visual Paradigm for State Diagram Creation
Visual Paradigm is a powerful UML modeling tool that simplifies the creation of state diagrams. Its features include:
-
Drag-and-Drop Interface: Easily add states, transitions, and actions.
-
Simulation Tools: Test state transitions to validate the diagram’s logic.
-
Templates: Use pre-built templates for systems like ATMs to speed up modeling.
-
Code Generation: Generate code skeletons (e.g., Java, C++) from the diagram.
-
Collaboration: Real-time team editing and commenting for collaborative projects.
To create the ATM state diagram in Visual Paradigm:
-
Open Visual Paradigm and select Diagram > New > State Machine Diagram.
-
Add states (e.g., Turned Off, Self Test, Idle) using the drag-and-drop editor.
-
Draw transitions with appropriate triggers (e.g., “Power On,” “Card Insertion”).
-
Define actions (e.g., readCard, ejectCard) for entry, exit, or transitions.
-
Use simulation to test the flow and ensure accuracy.
Conclusion
The Bank ATM state diagram effectively illustrates how UML state diagrams can model the behavior of real-world systems. By defining clear states, event-driven transitions, and actions, the diagram provides a structured representation of the ATM’s operation. This approach enhances understanding, facilitates system design, and supports implementation and maintenance. Tools like Visual Paradigm make it easier to create, test, and share such diagrams, ensuring accuracy and collaboration in system development.