Introduction
Unified Modeling Language (UML) is a standardized framework for visualizing, specifying, constructing, and documenting software systems. Among its behavioral diagrams, state diagrams (also known as state machine diagrams) and activity diagrams are essential for modeling dynamic system behavior. While both diagrams depict how a system operates over time, they serve distinct purposes and are applied in different contexts. This comprehensive guide explores the differences between state diagrams and activity diagrams, provides guidance on when to use each, and illustrates their applications with realistic examples. Additionally, it highlights how Visual Paradigm, a leading UML modeling tool, enhances the creation of these diagrams.
State Diagrams
Definition
A state diagram illustrates the various states an object can occupy and the transitions between those states triggered by specific events. Each state represents a condition or situation during an object’s lifecycle, and transitions indicate how the object moves from one state to another in response to stimuli, such as user actions or system signals. State diagrams are particularly effective for modeling the dynamic behavior of a single object or system with a finite number of states.
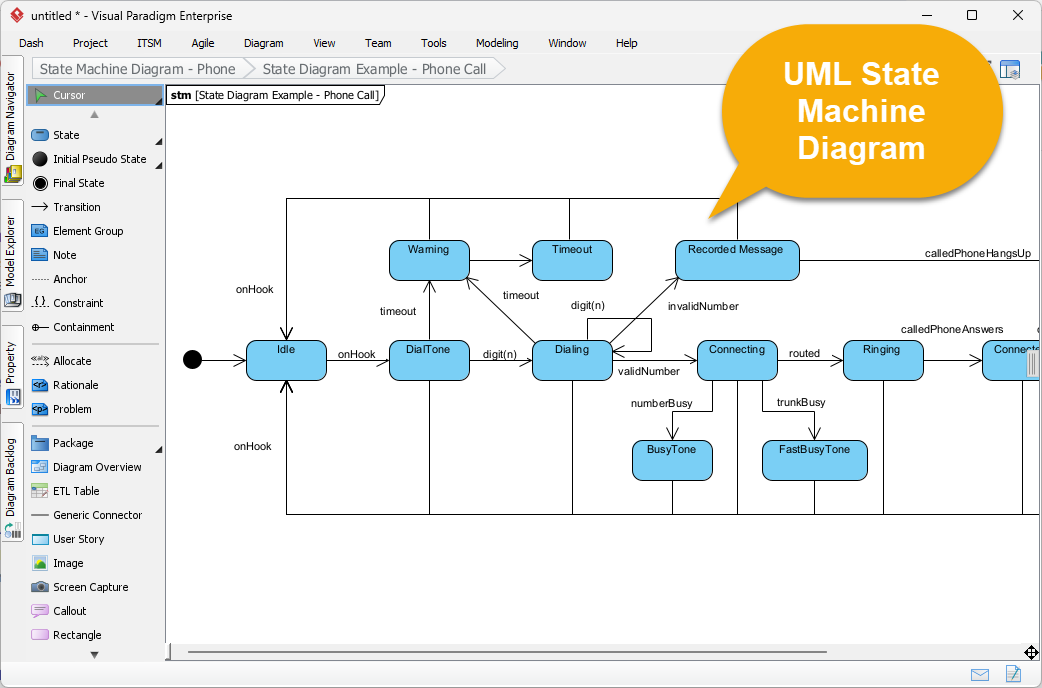
When to Use
State diagrams are best suited for:
-
Reactive Systems: Systems that respond to external or internal events, such as user inputs or system signals.
-
Object Lifecycles: Capturing how an object evolves from creation to termination.
-
State-Dependent Behavior: When a system’s behavior varies based on its current state.
Examples
-
Traffic Light System
-
States: Red, Yellow, Green
-
Events: Timer expires (e.g., after 30 seconds, transition from Green to Yellow)
-
Description: Models the cyclic behavior of a traffic light, where each state dictates whether vehicles stop, prepare to stop, or proceed.
-
-
ATM Machine
-
States: Idle, Card Inserted, PIN Entered, Transaction Processing, Dispensing Cash
-
Events: Insert Card, Enter PIN, Select Withdrawal Amount, Confirm Transaction
-
Description: Represents the ATM’s behavior as it processes user interactions, ensuring valid transitions (e.g., PIN validation before transaction).
-
-
E-commerce Order
-
States: Pending, Paid, Shipped, Delivered, Cancelled
-
Events: Payment Received, Shipment Dispatched, Customer Cancels
-
Description: Tracks an order’s lifecycle, showing how customer or system actions drive state changes.
-
-
Coffee Machine
-
States: Idle, Selecting Drink, Brewing, Dispensing
-
Events: Insert Coin, Select Drink, Brew Complete
-
Description: Models a coffee machine’s operation, where user inputs like coin insertion trigger state transitions.
-
-
Game Character
-
States: Idle, Walking, Running, Jumping
-
Events: Press Arrow Key, Press Space, Release Key
-
Description: Captures a video game character’s behavior based on player inputs, such as moving or jumping.
-
-
Printer System
-
States: Ready, Printing, Out of Paper, Error
-
Events: Print Request, Paper Jam, Load Paper, Clear Error
-
Description: Represents a printer’s response to events like paper jams or print commands.
-
Activity Diagrams
Definition
An activity diagram models the flow of activities or actions within a system, focusing on the sequence, decisions, and parallel processes involved. It is used to depict workflows, business processes, or algorithmic steps, often including decision points, forks (for parallel activities), and joins (for synchronization). Unlike state diagrams, activity diagrams emphasize the flow of control rather than specific states.
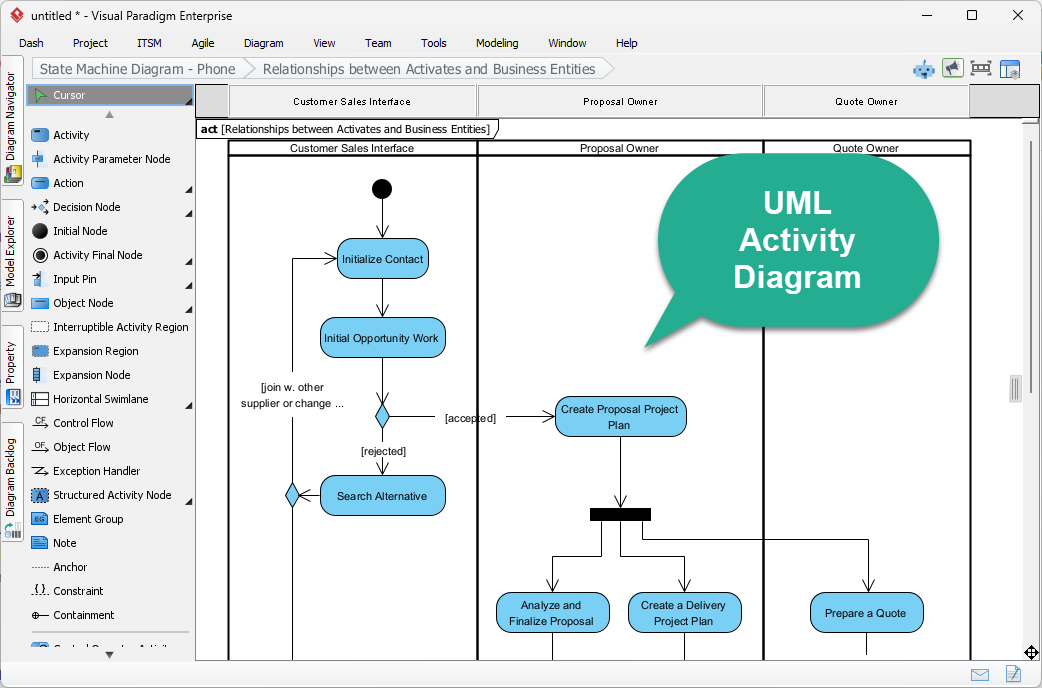
When to Use
Activity diagrams are ideal for:
-
Business Processes: Mapping workflows or procedures in an organization.
-
Algorithms: Illustrating step-by-step execution of a program or function.
-
Use Case Scenarios: Detailing the flow of events in a specific use case.
-
Concurrent Processes: Modeling parallel activities and their coordination.
Examples
-
Order Fulfillment Process
-
Activities: Receive Order, Check Inventory, Package Items, Ship Order
-
Decisions: Is inventory available? (Yes/No)
-
Description: Models the steps from receiving an online order to shipping, including decision points for inventory checks.
-
-
Loan Approval Workflow
-
Activities: Submit Application, Credit Check, Document Verification, Approve/Deny Loan
-
Parallel Tasks: Verify Income, Check Credit History
-
Decisions: Credit Check Pass/Fail
-
Description: Represents a bank’s loan approval process, with parallel verification tasks and decision points.
-
-
User Registration Flow
-
Activities: Enter Details, Validate Email, Create Account, Send Confirmation
-
Description: Details the steps for a user to register on a website, including validation and confirmation.
-
-
Assembly Line
-
Parallel Activities: Assemble Parts, Quality Check, Package Product
-
Description: Models a manufacturing process where multiple tasks occur simultaneously, synchronized before packaging.
-
-
Patient Admission Process
-
Activities: Triage, Diagnosis, Treatment Plan, Discharge
-
Description: Illustrates the workflow for admitting and treating a patient in a hospital.
-
-
Online Payment Processing
-
Activities: Enter Payment Details, Process Payment, Confirm Transaction
-
Decisions: Payment Successful? (Yes/No)
-
Activities on Failure: Refund, Notify User
-
Description: Maps the steps for processing an online payment, including handling failures.
-
-
Software Development Process
-
Activities: Requirements Gathering, Design, Implementation, Testing, Deployment
-
Decisions: Approve Design, Pass/Fail Tests
-
Description: Models the lifecycle of software development, with decision points for approvals and testing outcomes.
-
Comparison: State Diagrams vs. Activity Diagrams
State diagrams and activity diagrams both model dynamic behavior, but their focus and application differ significantly. The table below summarizes the key differences:
|
Aspect |
State Diagram |
Activity Diagram |
|---|---|---|
|
Focus |
Object states and transitions |
Flow of activities |
|
Triggers |
Events (e.g., user actions, system signals) |
Completion of activities |
|
Use Case |
Reactive systems, object lifecycles |
Workflows, business processes, algorithms |
|
Complexity |
Models state-dependent behavior |
Models control flow, parallelism, decisions |
|
Best For |
Systems with clear states (e.g., devices, orders) |
Processes with sequential or parallel steps (e.g., workflows) |
Choosing the Right Diagram
-
Use State Diagrams when modeling systems where behavior depends on discrete states and external events. Examples include devices (e.g., ATMs, coffee machines), authentication systems, or order lifecycles. They are particularly useful for systems where the current state dictates the response to an event.
-
Use Activity Diagrams when modeling processes or workflows that involve sequential or parallel steps, decisions, or roles. They are ideal for business processes (e.g., order fulfillment, loan approval), algorithms, or use case scenarios where the focus is on the flow of actions rather than states.
How Visual Paradigm Enhances UML Modeling
Visual Paradigm is a powerful UML modeling tool that supports the creation of both state diagrams and activity diagrams, offering features that streamline the design process and enhance collaboration. Its Community Edition is free, making it accessible for students, hobbyists, and small teams. Below are key features that support UML modeling:
For State Diagrams
-
Drag-and-Drop Editor: Easily add states, transitions, and events with an intuitive interface.
-
State Transition Simulation: Test state transitions dynamically to validate system behavior.
-
Code Generation: Generate code skeletons (e.g., Java, C++) from state diagrams, aiding implementation.
-
Guard Conditions: Add conditions (e.g., [balance > 0]) to transitions for precise modeling.
For Activity Diagrams
-
Swimlane Support: Partition activities by roles or components (e.g., Customer, System) for clarity in complex workflows.
-
Simulation Tools: Animate workflows to identify bottlenecks or inefficiencies.
-
Decision and Fork/Join Nodes: Easily model decision points and parallel activities.
General Features
-
Real-Time Collaboration: Teams can co-edit diagrams, add comments, and track changes in real time.
-
Templates and Examples: Access pre-built templates for common scenarios, such as ATM systems or order processing.
-
Export and Reporting: Export diagrams to PDF, HTML, or Word for stakeholder reviews and generate detailed reports.
-
Integration with Use Cases: Link diagrams to use cases for end-to-end traceability in system design.
Example Workflow in Visual Paradigm
-
Creating a State Diagram for a Vending Machine
-
Open Visual Paradigm and select Diagram > New > State Machine Diagram.
-
Add states: Idle, Selecting Item, Processing Payment, Dispensing Item.
-
Draw transitions with events: Coin Inserted, Item Selected, Payment Confirmed.
-
Use simulation to test the flow of states.
-
-
Creating an Activity Diagram for Online Shopping
-
Select Diagram > New > Activity Diagram.
-
Add activities: Browse Items, Add to Cart, Checkout, Process Payment.
-
Use swimlanes to separate customer and system actions.
-
Add decision nodes (e.g., Payment Successful?) and parallel tasks if needed.
-
Visual Paradigm’s intuitive interface, simulation capabilities, and collaboration features make it an ideal tool for creating professional UML diagrams, whether for academic, personal, or professional projects.
Conclusion
State diagrams and activity diagrams are powerful tools for modeling dynamic system behavior in UML. State diagrams excel at capturing state-dependent behavior in reactive systems, such as devices or order lifecycles, while activity diagrams are ideal for modeling workflows, processes, and algorithms with sequential or parallel steps. By understanding their differences and applications, you can choose the right diagram for your modeling needs. Visual Paradigm enhances this process with its user-friendly interface, simulation tools, and collaboration features, making it a top choice for UML modeling in both agile and traditional development environments.