


Strategic planning often requires balancing a complex mix of products, determining which ones drive profit and which ones drain resources. For product managers in fast-moving industries like FMCG, visualizing this balance is critical. In this deep dive, we will explore how to conduct a comprehensive portfolio review using the AI-powered BCG Matrix Analysis Tool by Visual Paradigm. We will follow a practical example of “FreshWave Beverages,” a hypothetical manufacturer, to demonstrate how this tool simplifies strategic decision-making.
Whether you are a business owner looking to restructure or a student learning strategic frameworks, this guide will walk you through the process step-by-step. By leveraging the tool’s integrated AI, we can transform a simple business description into a detailed, professional strategic report in minutes.
Quick Summary: What You Will Learn
- AI-Assisted Setup: How to use generative AI to populate your initial matrix based on your industry.
- Quadrant Analysis: A detailed walkthrough of classifying products into Stars, Cash Cows, Question Marks, and Dogs.
- Data Management: How to edit market shares, growth rates, and assign responsible parties for each product.
- Strategic Reporting: How to generate and interpret a consolidated report for stakeholder meetings.
Step 1: initiating the Analysis with AI Context
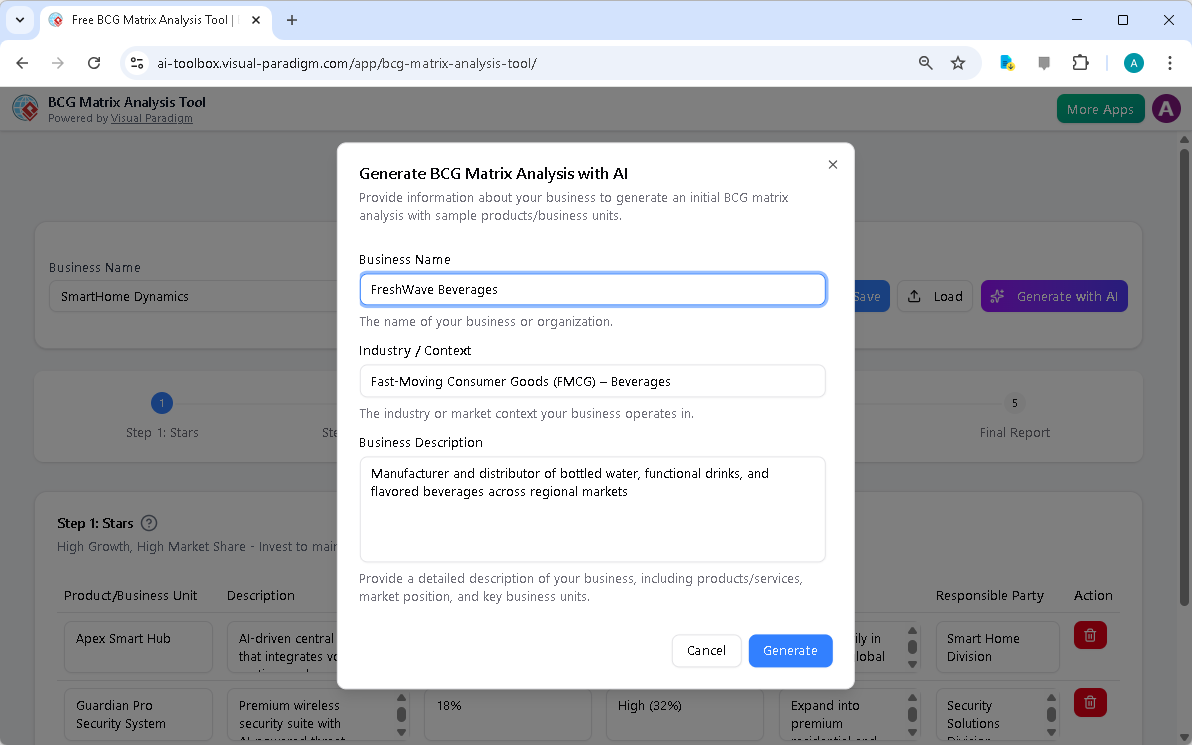
The first challenge in any strategic analysis is gathering the initial data. Visual Paradigm’s BCG Matrix Analysis Tool streamlines this with an intelligent setup wizard. Rather than starting with a blank spreadsheet, you begin by defining your business context. This allows the AI to understand your specific market environment and suggest relevant entries.
In our example, we are analyzing “FreshWave Beverages.” As shown in the interface below, we enter the business name and specify the Industry / Context as “Fast-Moving Consumer Goods (FMCG) – Beverages.” We also provide a brief description, noting that the company manufactures bottled water, functional drinks, and flavored beverages. Once this context is set, clicking “Generate” prompts the AI to draft a full analysis, populating all four quadrants of the matrix with plausible products and strategies.
Step 2: Identifying Your “Stars”
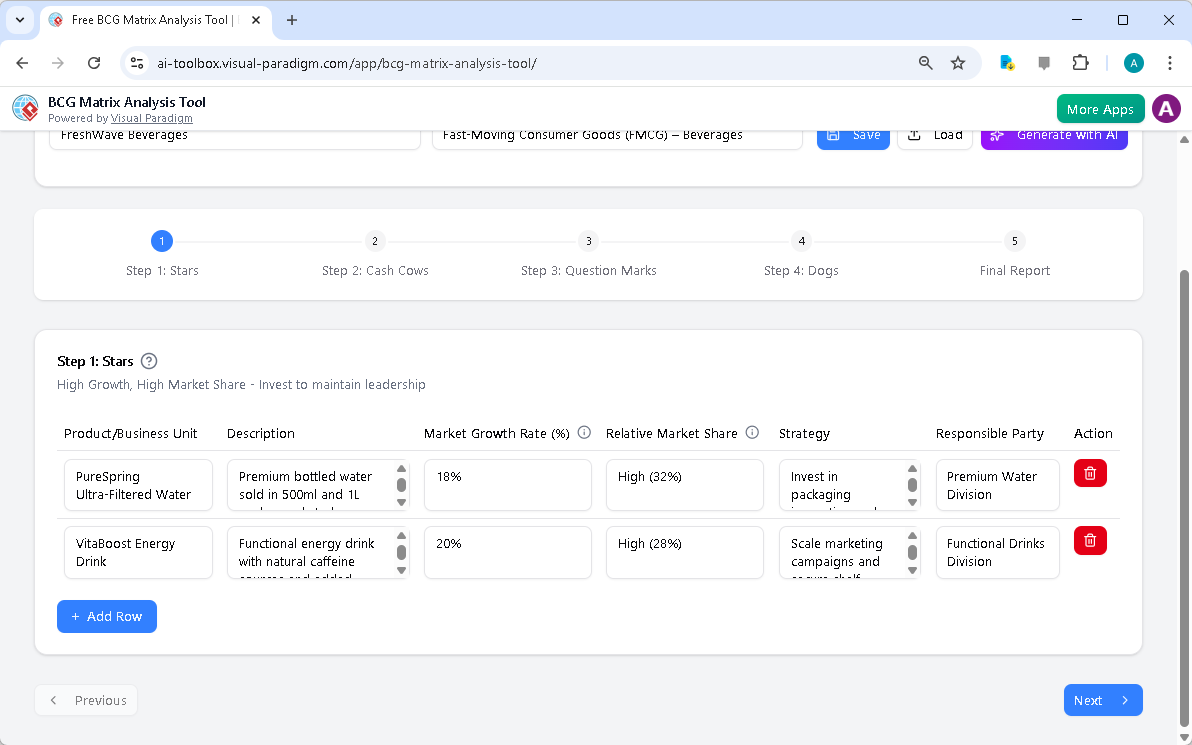
Once the AI generates the initial draft, the tool guides you through a 5-step wizard to refine the data. The first quadrant we address is Stars. In the BCG framework, Stars are business units with high market share in a high-growth industry. These products require heavy investment to maintain their lead but offer significant future potential.
Looking at the generated data for FreshWave Beverages, the tool has correctly identified “PureSpring Ultra-Filtered Water” and “VitaBoost Energy Drink” as Stars. Notice the data points: PureSpring has a Market Growth Rate of 18% and a high relative market share. The tool allows you to directly edit these figures or modify the recommended strategy, which in this case is to “Invest in packaging.” This interactive table ensures that you can fine-tune the AI’s suggestions to match your actual internal data.
Step 3: Managing “Cash Cows” for Stability
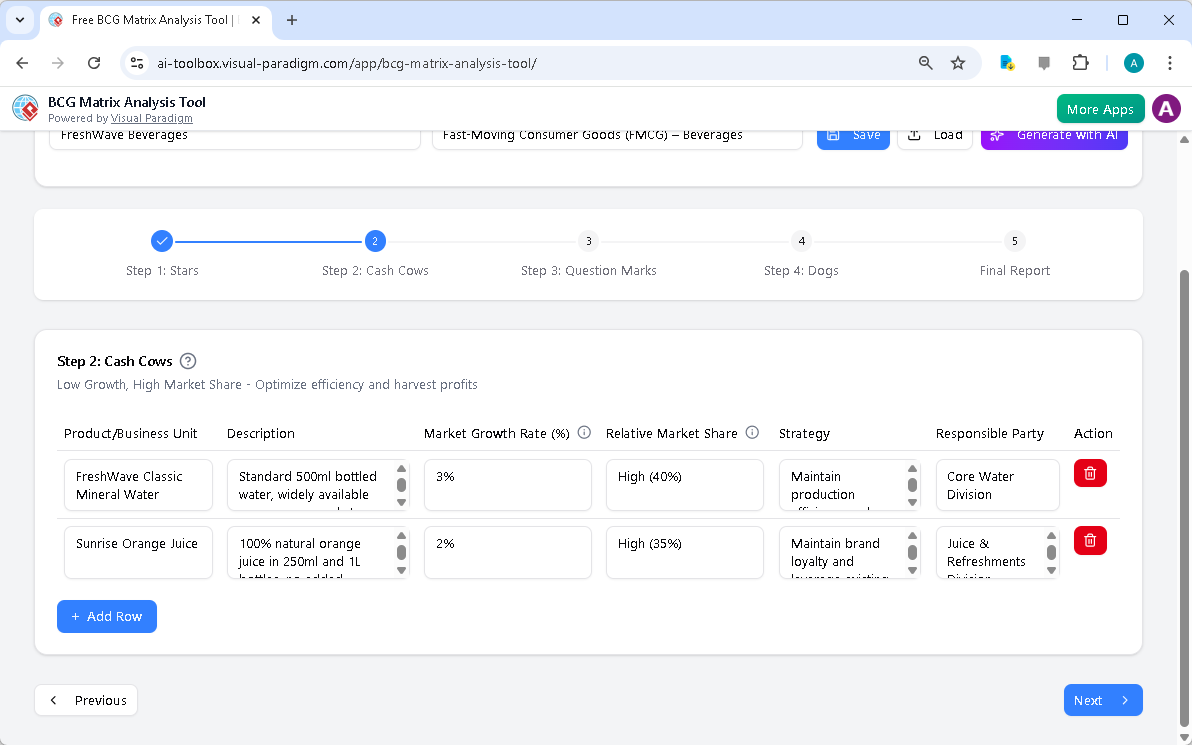
After reviewing your high-growth products, you proceed to the next step: Cash Cows. These are products that hold a high market share in a low-growth, mature market. They are the engines of profitability, generating cash that can be reinvested into other areas of the business.
For FreshWave, the analysis identifies “FreshWave Classic Mineral Water” and “Sunrise Orange Juice” as the primary Cash Cows. The growth rates here are significantly lower (3% and 2% respectively), but the market share is dominant (40% and 35%). The strategy column reflects the classic BCG approach: “Maintain production efficiency” and “Harvest profits.” This section of the strategic planning application helps product managers confirm which legacy products are funding the company’s innovation.
Step 4: Evaluating “Question Marks”
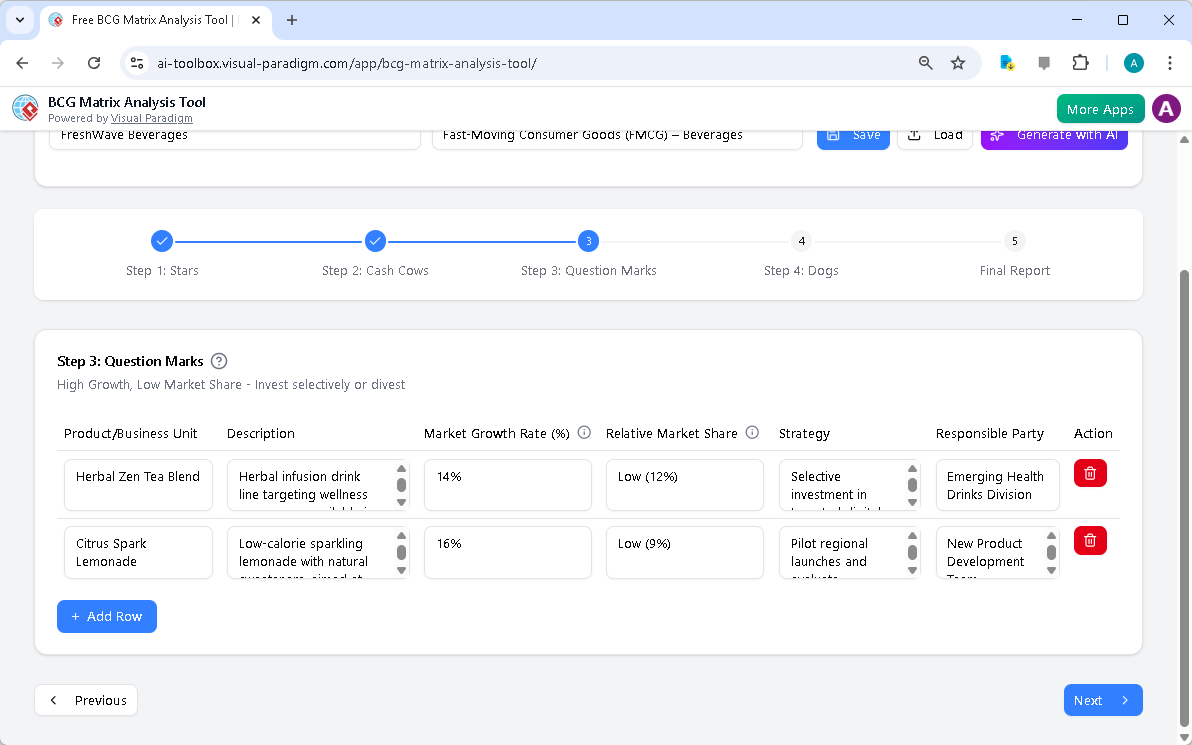
The third step focuses on Question Marks (sometimes called “Problem Children”). These products operate in a high-growth market but currently hold a low market share. They represent a strategic dilemma: should you invest heavily to turn them into Stars, or should you divest to avoid wasting resources?
In our FMCG example, the tool highlights “Herbal Zen Tea Blend” and “Citrus Spark Lemonade.” The market for these wellness-oriented drinks is growing fast (14-16%), yet FreshWave’s share is low (9-12%). The interface allows you to assign a “Responsible Party,” such as the Emerging Health Drinks Division, ensuring that specific teams are accountable for deciding the future of these uncertain products. This feature transforms the matrix from a theoretical exercise into an actionable plan.
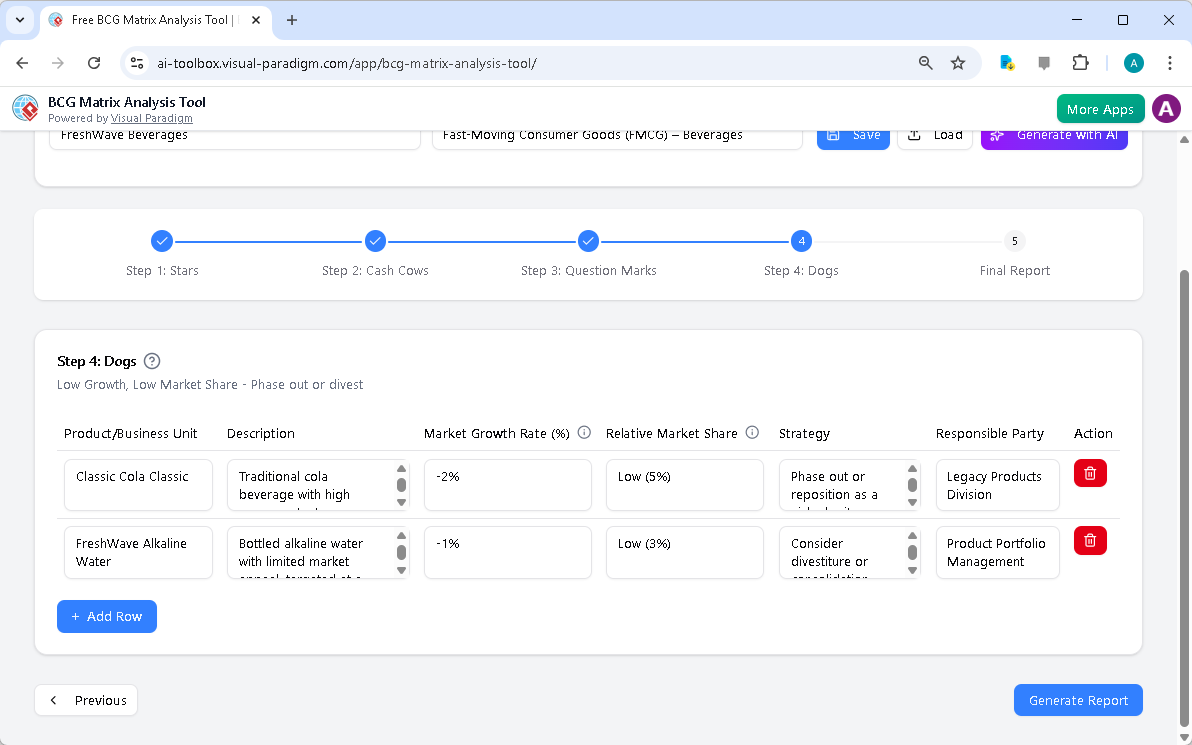
Step 5: Addressing “Dogs” and Divestiture
The final input stage involves the Dogs quadrant. These are products with low market share in low-growth markets. They typically generate low profits or even losses and often consume more management time than they are worth.
The analysis for FreshWave Beverages is clear: “Classic Cola Classic” shows a negative growth rate (-2%) and a minimal market share of 5%. The recommended strategy in the tool is to “Phase out or reposition.” By visualizing these underperformers clearly, the online analysis tool helps executives make the difficult but necessary decision to divest or liquidate, freeing up capital for the Stars and Question Marks identified earlier.
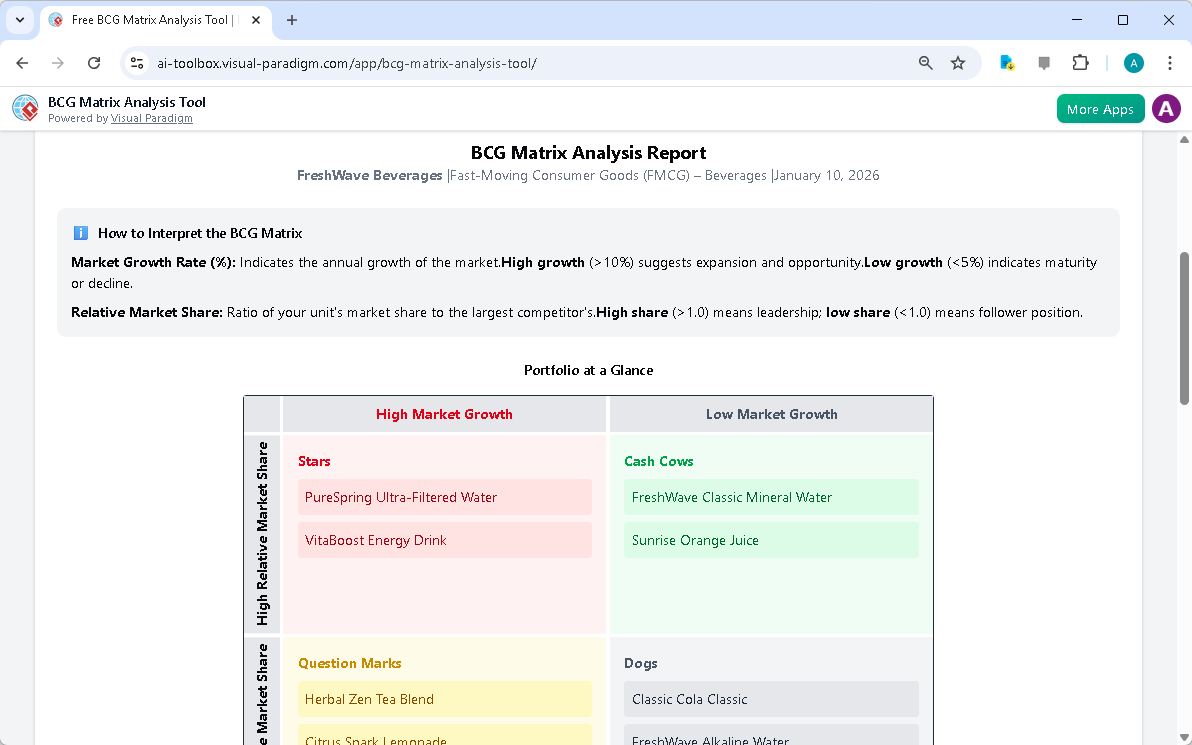
Step 6: The Consolidated Strategic Report
After meticulously reviewing all four quadrants, you arrive at the final step: the Consolidated Final Report. This is where the true value of the Visual Paradigm tool becomes apparent. It aggregates all the data points, strategies, and responsible parties you defined in the previous steps into a single, professional document.
As seen in the final output, the report offers a “Portfolio at a Glance” view. It color-codes the products into their respective quadrants—Red for Stars, Green for Cash Cows, Yellow for Question Marks, and Grey for Dogs. This visual summary is perfect for presenting to stakeholders or board members. You can print this report or save it as a PDF directly from the browser, ensuring you have a tangible roadmap for your strategic portfolio management.
Conclusion
Visual Paradigm’s BCG Matrix Analysis Tool effectively bridges the gap between complex strategic theory and practical application. By using the FreshWave Beverages example, we demonstrated how the tool allows for a structured, step-by-step review of an entire product portfolio. From AI-assisted generation to manual refinement and final reporting, the workflow is designed to give business leaders clarity on where to invest and where to cut back.
Ready to gain clarity on your own product strategy? You can start analyzing your portfolio immediately without needing a cloud account.
Try the AI-Powered BCG Matrix Analysis Tool Now