


Projects frequently stall not because of technical debt, but because of undefined boundaries. Scope creep remains one of the most persistent challenges in system development, often eroding budgets and timelines without immediate visibility. When requirements expand incrementally without formal approval, the original design intent becomes obscured. This is where structured documentation becomes critical. Specifically, Data Flow Diagrams (DFDs) offer a visual and logical framework for maintaining control over system boundaries. By implementing a rigorous governance model around these diagrams, organizations can enforce clarity and accountability at every stage of the lifecycle. 📉
This guide details the mechanisms required to prevent scope creep through disciplined Data Flow Diagram governance. We will explore the structural integrity of DFDs, the protocols for change management, and the governance frameworks necessary to sustain project alignment. The focus remains on process, standards, and human oversight rather than specific tools. 📝
Understanding Scope Creep in System Design 🧩
Scope creep is the uncontrolled expansion of project requirements without adjustments to time, cost, or resources. It often begins subtly. A stakeholder requests a minor feature addition. A developer interprets a vague requirement loosely. Over time, these small deviations accumulate. The result is a system that no longer matches the initial contract or business case.
Preventing this requires a mechanism to distinguish between valid changes and unauthorized expansions. Visual documentation serves as the baseline for this distinction. When a change is proposed, it must be mapped against the existing system architecture. If a Data Flow Diagram does not support the new request without significant structural alteration, the request is flagged for review.
Common triggers for scope creep include:
- Unclear Requirements: Ambiguous statements that allow multiple interpretations.
- Stakeholder Evolution: Changing business needs that are not formally documented.
- Technical Debt: Quick fixes that introduce new, unplanned data paths.
- Missing Boundaries: Failure to define what is inside and outside the system context.
The Role of Data Flow Diagrams in Control 📊
Data Flow Diagrams are more than just technical drawings; they are boundary definitions. A DFD represents how data moves through a system, identifying processes, data stores, external entities, and data flows. When governed correctly, these diagrams act as a contract between the business and the technical team.
Key components of a governed DFD:
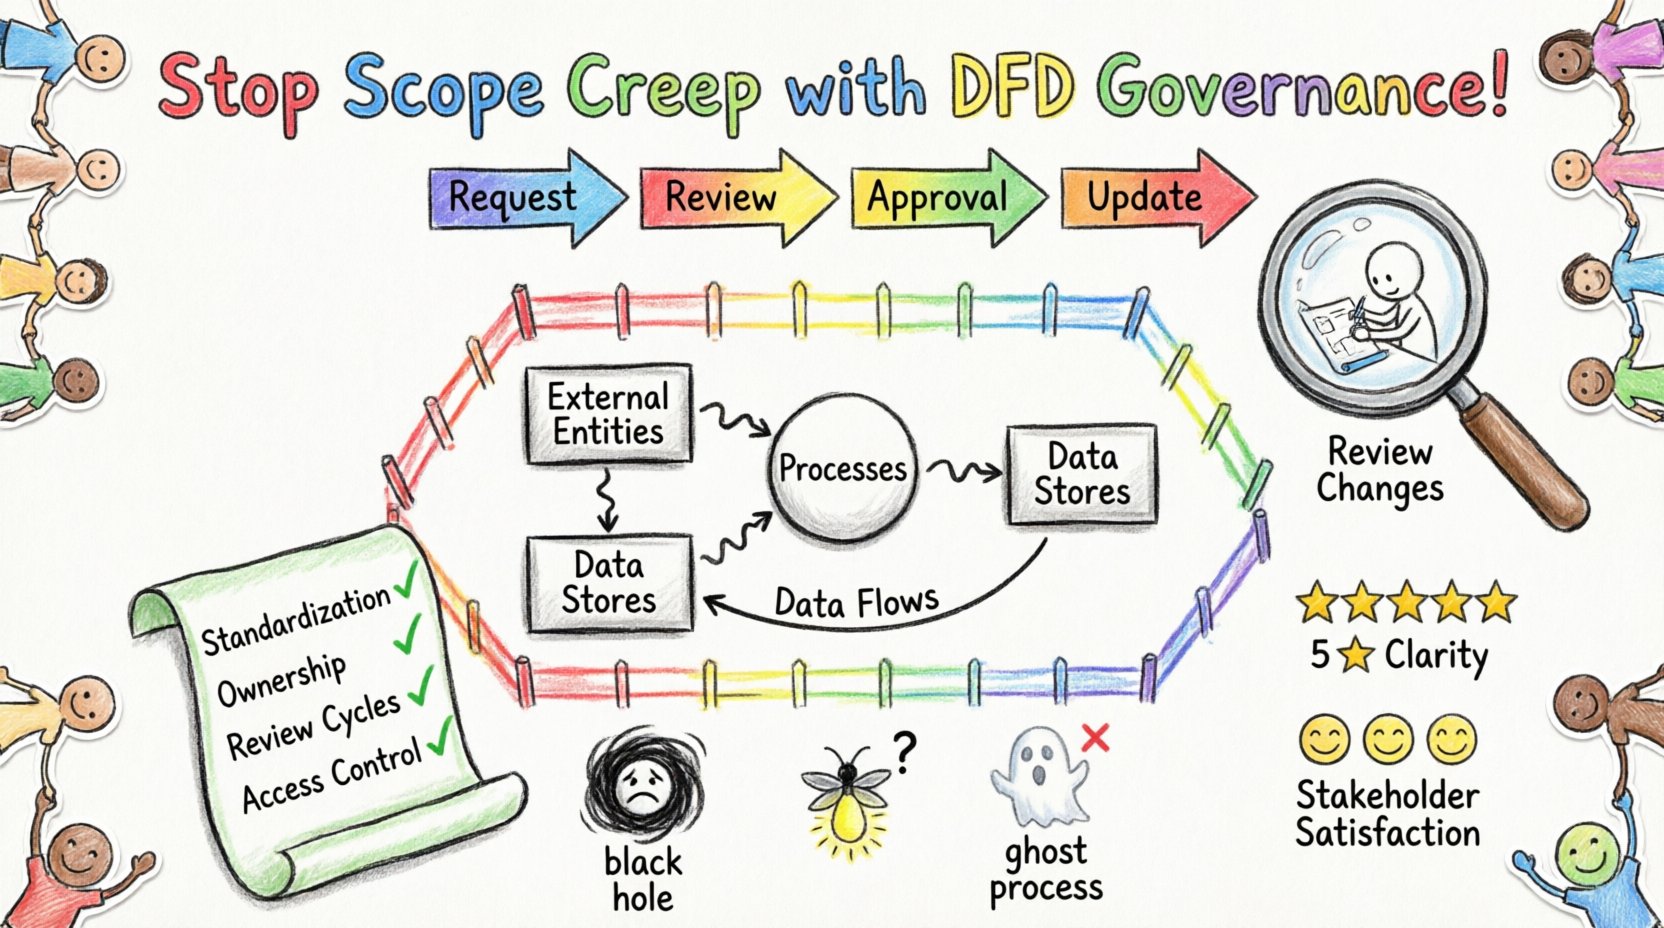
- External Entities: Clearly defined sources and destinations of data outside the system.
- Processes: Transformations that occur within the system boundaries.
- Data Stores: Persistent storage locations with defined access rights.
- Data Flows: The movement of data, labeled with specific attributes.
By adhering to standard notation, teams ensure that every diagram tells a consistent story. Deviations from standard symbols often lead to confusion. A process circle might mean a transformation to one team and a database to another. Governance enforces consistency. This reduces the likelihood of misinterpretation that leads to unwanted scope additions.
Establishing Governance Protocols 🔒
Governance is the framework of policies and procedures that guide how diagrams are created, reviewed, and maintained. Without a protocol, diagrams become outdated artifacts. With governance, they become living documents that drive decision-making.
Core elements of DFD Governance:
- Standardization: Define the notation rules (e.g., Gane & Sarson or Yourdon & DeMarco). Ensure all diagrams follow the same visual language.
- Ownership: Assign specific roles for diagram creation and approval. A Diagram Owner is responsible for accuracy.
- Review Cycles: Schedule regular reviews to ensure diagrams match the current implementation.
- Access Control: Limit who can modify diagrams. Only authorized personnel should alter the source of truth.
When a diagram is treated as a controlled asset, changes require justification. This simple shift in mindset reduces casual feature requests that were previously accepted without review.
Version Control and Change Management 🔄
Systems evolve. Requirements change. The DFD must evolve with them, but not without a record. Version control is essential for tracking the history of scope changes. Every revision of a diagram should be logged with a timestamp, author, and change description.
Change Management Workflow:
- Identification: A change request is submitted regarding a process or data flow.
- Impact Analysis: The Diagram Owner assesses how the change affects other parts of the diagram.
- Approval: A change control board or designated authority reviews the impact.
- Implementation: The diagram is updated in the controlled repository.
- Notification: All stakeholders are notified of the update.
This workflow ensures that no change is made in isolation. If a new data flow is introduced, the governance process requires identifying where that data comes from and where it goes. This visibility often reveals that a “simple” request requires significant backend infrastructure changes. This insight helps stakeholders make informed decisions about whether the scope addition is worth the cost.
Stakeholder Alignment Strategies 👥
Scope creep often stems from misalignment between business expectations and technical reality. Data Flow Diagrams bridge this gap by translating complex logic into visual representations. However, stakeholders must understand how to read them. Governance includes training and communication.
Strategies for alignment:
- Visual Workshops: Conduct sessions where stakeholders walk through the DFD with the technical team. This clarifies data boundaries.
- Context Diagrams: Use Level 0 diagrams to show high-level interactions. This helps stakeholders see the system as a whole.
- Traceability Matrices: Link specific diagram elements to business requirements. If a requirement has no corresponding diagram element, it is likely out of scope.
When stakeholders see the data flows visually, they understand the dependencies. A request for a new report might look easy, but the DFD reveals that the data does not currently exist in a store. This prevents the assumption that “just add a field” is a low-cost change.
Common Pitfalls in DFD Maintenance 🚧
Even with a governance framework, teams often fall into traps that weaken the control structure. Recognizing these pitfalls is crucial for maintaining integrity.
Typical maintenance errors:
- Black Holes: Processes that have inputs but no outputs. This indicates missing logic or incomplete scope definition.
- Fireflies: Data flows without a destination. This suggests data is lost or unaccounted for.
- Ghost Processes: Processes that exist in the diagram but have no corresponding code or functionality.
- Outdated Symbols: Using obsolete notation that confuses the reader.
Regular audits are necessary to catch these issues. An audit is not just a technical check; it is a scope verification. If a process is listed but not implemented, it represents a waste of resources or a misunderstanding of the current state.
Metrics for Governance Success 📈
To ensure the governance model is effective, organizations should track specific metrics. These metrics provide data on the health of the documentation and the stability of the project scope.
Key Performance Indicators:
| Metric | Description | Target |
|---|---|---|
| Diagram Accuracy Rate | Percentage of diagrams matching the actual system | > 95% |
| Change Request Volume | Number of changes proposed per iteration | Stable or Decreasing |
| Review Cycle Time | Time taken to approve a diagram update | Within 3 Days |
| Scope Variance | Difference between planned and actual scope | < 5% |
A high volume of change requests might indicate that the initial requirements were poorly defined. A low accuracy rate suggests that the diagrams are not being updated as the system changes. These metrics inform where governance efforts need to be strengthened.
Integration with Requirements Management 📋
Data Flow Diagrams should not exist in a vacuum. They must be integrated with the broader requirements management system. Every process in a DFD should trace back to a functional requirement. Every data flow should trace back to a data requirement.
Integration steps:
- Mapping: Create links between diagram nodes and requirement IDs.
- Validation: Check if any requirement lacks a diagram representation.
- Traceability: When a requirement changes, the linked diagram is flagged for review.
This integration ensures that scope creep is caught at the requirements level. If a stakeholder requests a new feature, the team checks the requirements database. If the requirement exists, they check the DFD. If the DFD does not support it, the change is formalized.
Audit and Review Cycles 🕒
Static documentation fails. The only way to maintain governance is through regular review cycles. These should not be ad-hoc. They must be scheduled and mandatory.
Recommended Review Cadence:
- Pre-Design: Review the Context Diagram before development begins.
- Milestone Reviews: Review detailed diagrams at the end of each development phase.
- Post-Implementation: Compare the final system against the final DFD to ensure accuracy.
- Annual Audit: Comprehensive check of all diagrams against the current business reality.
During these reviews, the focus is on fidelity. Does the diagram represent the system? If not, the diagram is updated, and the change is logged. This continuous loop prevents the accumulation of technical debt in the documentation itself.
Handling Exceptions and Emergencies 🚨
Not all changes can follow the standard governance path. Emergencies happen. A critical bug or a compliance requirement might demand immediate action. Governance must account for these exceptions without breaking the system.
Emergency Change Protocol:
- Expedited Approval: A designated authority can approve changes instantly.
- Documentation Lag: Updates to the DFD are documented immediately after the change is implemented.
- Retroactive Review: The change is reviewed in the next regular cycle to ensure it fits the long-term plan.
This protocol allows flexibility while maintaining accountability. It acknowledges that speed is sometimes necessary but ensures that the record is corrected as soon as possible to prevent future confusion.
Building a Culture of Documentation 🏗️
Tools and processes are useless without a supportive culture. Teams must value documentation as a deliverable, not an administrative burden. Governance is successful when team members proactively update diagrams because they understand the value.
Cultural enablers:
- Leadership Support: Management must enforce the requirement for updated diagrams before releases.
- Recognition: Acknowledge teams that maintain high-quality documentation.
- Training: Invest time in teaching team members how to create clear, effective diagrams.
- Accessibility: Ensure diagrams are easy to find and read for everyone involved.
When documentation is valued, scope creep becomes easier to identify. The team sees the diagram as a shared map. Deviations are obvious. The collective goal shifts from “getting it done” to “getting it done right.”
Conclusion: Sustaining Control 🏁
Preventing scope creep is not about restricting innovation. It is about ensuring that innovation is deliberate. Data Flow Diagrams provide the visual evidence needed to validate changes against the original design intent. By implementing a governance framework, organizations can manage evolution without losing control.
The path forward requires discipline. It requires regular reviews, clear ownership, and a commitment to accuracy. When these elements are in place, projects remain on track, budgets are respected, and the final system matches the business needs. Governance transforms diagrams from static pictures into active management tools. This is the foundation of sustainable system development.
Final Checklist for Implementation:
- ✅ Define DFD notation standards.
- ✅ Assign Diagram Owners.
- ✅ Establish Change Control Board.
- ✅ Schedule regular review cycles.
- ✅ Integrate with requirements tracking.
- ✅ Train stakeholders on diagram interpretation.
Adopting these steps creates a robust defense against scope creep. The effort invested in governance pays dividends in stability and predictability. For any organization seeking to improve project outcomes, this approach is essential. 🚀