Engineering and system design rely heavily on the precise coordination of events. When components interact, whether in silicon or code, time becomes a critical resource. A timing diagram serves as the visual contract that defines how these interactions should occur. It maps signal states against a timeline, revealing the sequence and duration of data transfers, control signals, and clock pulses. This document explores the practical application of timing diagrams across various technical domains, focusing on clarity, accuracy, and reliability without relying on specific commercial tools.
Understanding the Fundamentals 📊
A timing diagram is more than a chart; it is a blueprint for synchronization. In complex systems, a single microsecond of delay can cause data corruption or system failure. By visualizing the relationship between different signals, engineers can predict behavior before physical implementation begins.
At its core, a timing diagram plots time horizontally and signal logic levels vertically. The horizontal axis represents the progression of time, often marked in nanoseconds, clock cycles, or arbitrary units depending on the system speed. The vertical lines represent specific nodes or wires. High and low states correspond to binary logic levels, typically 1 and 0, or voltage thresholds.
Key reasons for using this visualization include:
- Verification: Ensuring that a design meets specifications before fabrication or deployment.
- Communication: Providing a clear reference for teams working on different subsystems.
- Debugging: Identifying where signals deviate from expected behavior during testing.
- Documentation: Creating a permanent record of system behavior for future maintenance.
Core Components of a Timing Diagram 🛠️
To read or create an effective diagram, one must understand the specific elements that constitute the visual language. Each element carries specific meaning regarding the physical or logical constraints of the system.
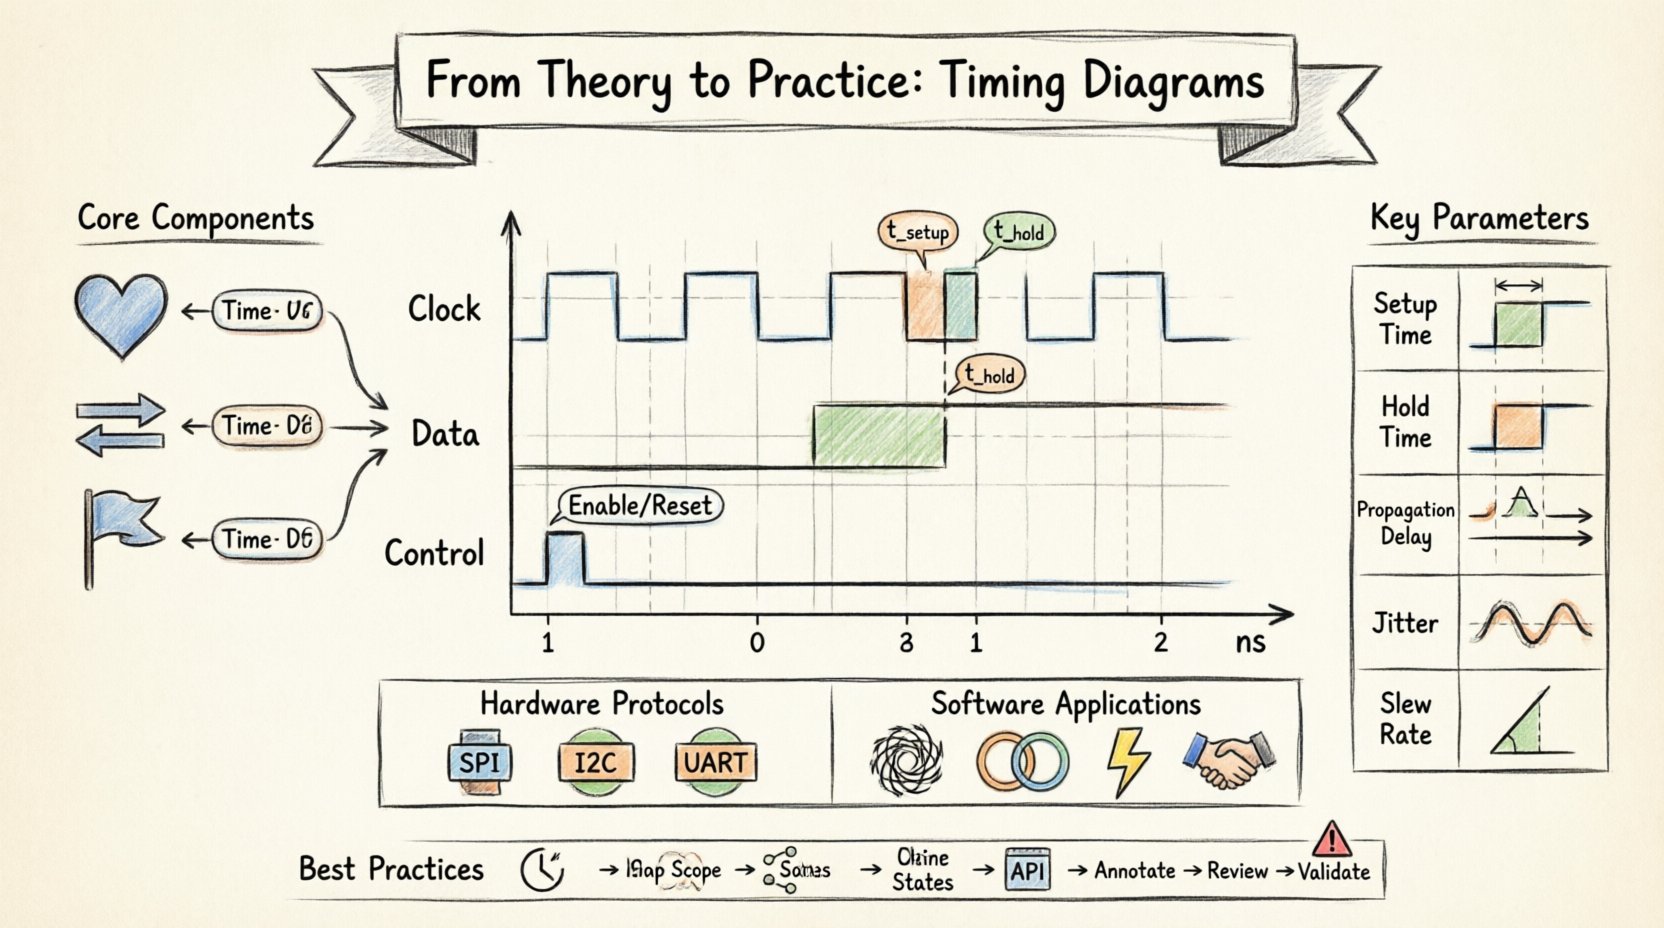
1. The Clock Signal
The clock acts as the heartbeat of synchronous systems. It dictates when data is sampled or latched. In a diagram, this appears as a repeating square wave. The period of the wave determines the maximum speed of operation. Engineers must ensure that all other signals settle within specific windows defined by the clock edges.
2. Data Lines
Data lines carry the actual information. Unlike the clock, which is regular, data transitions can be irregular. The diagram must show when data is stable and valid relative to the clock. This includes showing the transition from unknown to known states.
3. Control Signals
Signals such as enable, chip select, reset, or interrupt lines control the operation of the data path. These often appear as pulses or level-sensitive flags. Their timing relative to the clock and data is critical for correct function.
4. Time Markers
Specific points in time are often annotated with labels like t_setup or t_hold. These markers define the constraints that must be met. Without these annotations, the diagram is merely a picture of signals rather than a technical specification.
Hardware Implementation and Protocols 🖥️
In hardware design, timing diagrams are essential for defining electrical interfaces. Different protocols have distinct timing requirements that must be strictly adhered to for interoperability.
Serial Communication Standards
Protocols like SPI, I2C, and UART rely on precise timing for successful transmission. Each has unique rules regarding data shifting, clock polarity, and sampling points.
- SPI (Serial Peripheral Interface): Uses a clock line to synchronize data transfer. The diagram must show the relationship between the clock edge and the data bit change. Setup and hold times are crucial here.
- I2C (Inter-Integrated Circuit): Requires open-drain lines and specific timing for start and stop conditions. The timing diagram defines the minimum low and high periods for the clock and data lines.
- UART (Universal Asynchronous Receiver-Transmitter): While asynchronous, it still requires timing windows for sampling the bit stream at the correct baud rate.
Memory Interfaces
When interfacing with memory devices, timing becomes even more critical. The controller must wait for the memory to stabilize after a command is sent. The diagram illustrates the command latency, the data access window, and the precharge time.
Reset Sequences
Every digital system requires a reset to initialize its state. The timing diagram for a reset sequence shows the duration of the reset pulse and the delay before the system becomes operational. If the reset is too short, the system may not initialize correctly. If it is too long, it may delay startup unnecessarily.
Software and System Integration 🧩
While often associated with hardware, timing diagrams are equally vital in software engineering, particularly in embedded systems and concurrent programming. Here, the signals represent logical states, function calls, or event triggers.
Concurrency and Threads
In multi-threaded applications, timing diagrams help visualize race conditions. They show the order in which threads access shared resources. By mapping the execution timeline, developers can identify overlaps where data corruption might occur.
- Lock Acquisition: Shows when a thread holds a mutex and when it releases it.
- Wait States: Indicates periods where a thread is blocked waiting for an event.
- Deadlocks: Can be visualized as circular dependencies in the timing flow.
Event Loops and Interrupts
Real-time operating systems rely on interrupt handlers. A timing diagram maps the latency between an interrupt trigger and the completion of the handler. High priority interrupts must preempt lower priority tasks, and this priority shift is visible in the timeline.
API Handshakes
In distributed systems, APIs often use request-response cycles. A timing diagram can illustrate the latency between a client request and server response. This helps in understanding bottlenecks in the communication pipeline.
Key Timing Parameters Explained ⚙️
To apply these diagrams effectively, specific technical parameters must be understood. These metrics define the boundaries of valid operation.
| Parameter | Definition | Impact of Violation |
|---|---|---|
| Setup Time | Minimum time data must be stable before the clock edge. | Data capture failure or metastability. |
| Hold Time | Minimum time data must remain stable after the clock edge. | Data corruption or race conditions. |
| Propagation Delay | Time taken for a signal to travel from input to output. | Timing violations if delay exceeds clock period. |
| Jitter | Short-term variations of a signal with respect to its ideal position. | Reduced noise margin and increased error rate. |
| Slew Rate | Rate of change of a signal voltage or current over time. | Electromagnetic interference if too fast. |
Metastability
One of the most critical concepts in timing analysis is metastability. This occurs when a flip-flop receives an input change too close to the clock edge, causing the output to enter an undefined state. Timing diagrams help designers identify where asynchronous signals enter synchronous domains, allowing them to implement synchronizer chains.
Analyzing Signal Integrity 🔍
A timing diagram is not just about logic levels; it is also about signal quality. In high-speed designs, the shape of the wave matters. Rise times and fall times affect the timing margins.
- Rise Time: If a signal rises too slowly, it may cross the logic threshold at an unpredictable time, causing jitter.
- Fall Time: Similarly, slow fall times can lead to increased power consumption and timing errors.
- Overshoot/Undershoot: Signals exceeding voltage limits can damage components or cause false triggering.
- Reflections: In long traces, impedance mismatches cause reflections that distort the timing diagram.
When creating a diagram for analysis, engineers should annotate expected signal shapes, not just ideal square waves. This provides a realistic view of what the physical system will look like under load.
Common Pitfalls in Timing Analysis 🚫
Even experienced teams can encounter issues when applying timing diagrams. Recognizing common mistakes helps avoid costly redesigns.
1. Ignoring Clock Skew
Clock skew occurs when the clock signal arrives at different components at different times due to trace length differences. If the diagram assumes a perfect clock distribution, the setup and hold times will be incorrect.
2. Overlooking Asynchronous Resets
Asynchronous resets can introduce timing hazards if not handled correctly. The diagram must show the reset de-assertion relative to the clock to ensure the system starts cleanly.
3. Neglecting Temperature and Voltage
Timing parameters vary with environmental conditions. A diagram generated at room temperature may not hold up at extreme heat or low voltage. Designers should account for worst-case scenarios.
4. Inconsistent Time Scales
Combining signals with vastly different time scales on the same diagram can obscure important details. Using multiple time scales or zoomed-in views is often necessary for clarity.
Workflow for Creating Effective Diagrams 📝
Creating a timing diagram is a structured process. Following a workflow ensures consistency and accuracy across the project.
- Define the Scope: Identify which signals are relevant. Do not clutter the diagram with every wire in the system.
- Establish the Reference: Choose a starting point, such as a clock edge or a specific event trigger.
- Map the States: Draw the logic levels for each signal over time. Ensure transitions are aligned correctly.
- Annotate Constraints: Add labels for setup times, hold times, and delays.
- Review for Consistency: Check that the timing relationships match the system specifications.
- Validate with Simulation: If possible, compare the diagram against simulation waveforms to ensure accuracy.
Debugging with Timing Diagrams 🔧
When a system fails, the timing diagram becomes a diagnostic tool. Engineers compare the expected diagram against the actual captured waveforms.
Identifying Glitches
Glitches are short pulses that appear where none should exist. They often result from race conditions in combinational logic. A timing diagram helps isolate which path caused the glitch by showing the propagation delay of each path.
Locating Latency Issues
If a system is running slower than expected, the diagram reveals where delays accumulate. Long chains of logic or slow memory access times become visible.
Verifying Protocol Compliance
For communication interfaces, the diagram verifies compliance with the standard. If the start bit or stop bit timing is off, the receiver will fail to decode the data.
Best Practices for Clarity ✨
Readability is just as important as accuracy. A complex diagram that cannot be understood is useless.
- Use Consistent Symbols: Ensure that logic levels, clock edges, and delays are represented consistently throughout the document.
- Group Related Signals: Keep signals that belong to the same bus or module close together vertically.
- Label Everything: Never assume the reader knows what a specific line represents. Use clear labels for every signal.
- Use Color Sparingly: While color can help distinguish signals, rely on labels as well for black-and-white printing compatibility.
- Include a Legend: If using specific notations or abbreviations, provide a key.
Future Considerations in Timing Design 🚀
As systems become faster and more complex, timing analysis continues to evolve. The following trends are shaping how timing diagrams are used.
- Higher Frequencies: As clock speeds increase, signal integrity becomes more critical. Timing margins shrink, requiring more precise diagrams.
- Multi-Domain Systems: Modern systems combine analog, digital, and RF components. Timing diagrams must now account for mixed-signal interactions.
- Power Management: Dynamic voltage and frequency scaling add another layer of timing complexity. The diagram must show how power states affect timing parameters.
- Automation: While manual creation is valuable, automated tools are increasingly used to generate timing diagrams from design data. Understanding the underlying theory remains essential for validation.
Final Thoughts on Implementation 💡
Timing diagrams are a fundamental tool for anyone working with digital systems. They bridge the gap between abstract logic and physical reality. By understanding the constraints and applying them correctly, engineers can build systems that are robust and reliable.
The process of creating and reading these diagrams requires attention to detail. It is not enough to know that a signal goes high; one must know exactly when it goes high relative to other events. This precision is what separates a working prototype from a production-ready product.
When starting a new project, invest time in defining the timing requirements early. A well-documented timing diagram can save countless hours of debugging later. It serves as a reference point for the entire team, ensuring that everyone is working from the same understanding of the system’s behavior.
Whether designing a simple microcontroller circuit or a complex distributed network, the principles of timing remain the same. Respect the constraints, visualize the flow, and validate the results. This disciplined approach ensures that theory translates effectively into practice.
Checklist for Timing Diagram Review ✅
Before finalizing any timing documentation, use this checklist to ensure completeness.
- Are all signals labeled clearly?
- Is the time axis scale appropriate for the signals shown?
- Are setup and hold times annotated where required?
- Do the clock edges align correctly with data transitions?
- Are asynchronous signals handled with appropriate synchronizers?
- Is the diagram consistent with the system specifications?
- Have worst-case scenarios been considered?
- Is the diagram readable by someone unfamiliar with the specific project?
By adhering to these guidelines and maintaining a focus on precision, timing diagrams become a powerful asset in the engineering toolkit. They provide the clarity needed to navigate the complexities of modern system design.