Enterprise architecture requires clarity. Without a structured approach to visualization, complex organizational structures become indecipherable webs of information. This is where ArchiMate viewpoints become essential. They act as the lens through which different stakeholders view the enterprise. By isolating specific concerns, architects ensure that business leaders, application developers, and infrastructure engineers all receive the information they need without being overwhelmed.
This guide explores how to deploy ArchiMate viewpoints across the Business, Application, and Technology layers. We will examine practical scenarios, identify key elements, and discuss how to communicate effectively across these distinct domains. The goal is to build models that serve a purpose, not just to create diagrams.
🧠 Understanding the Core Concept
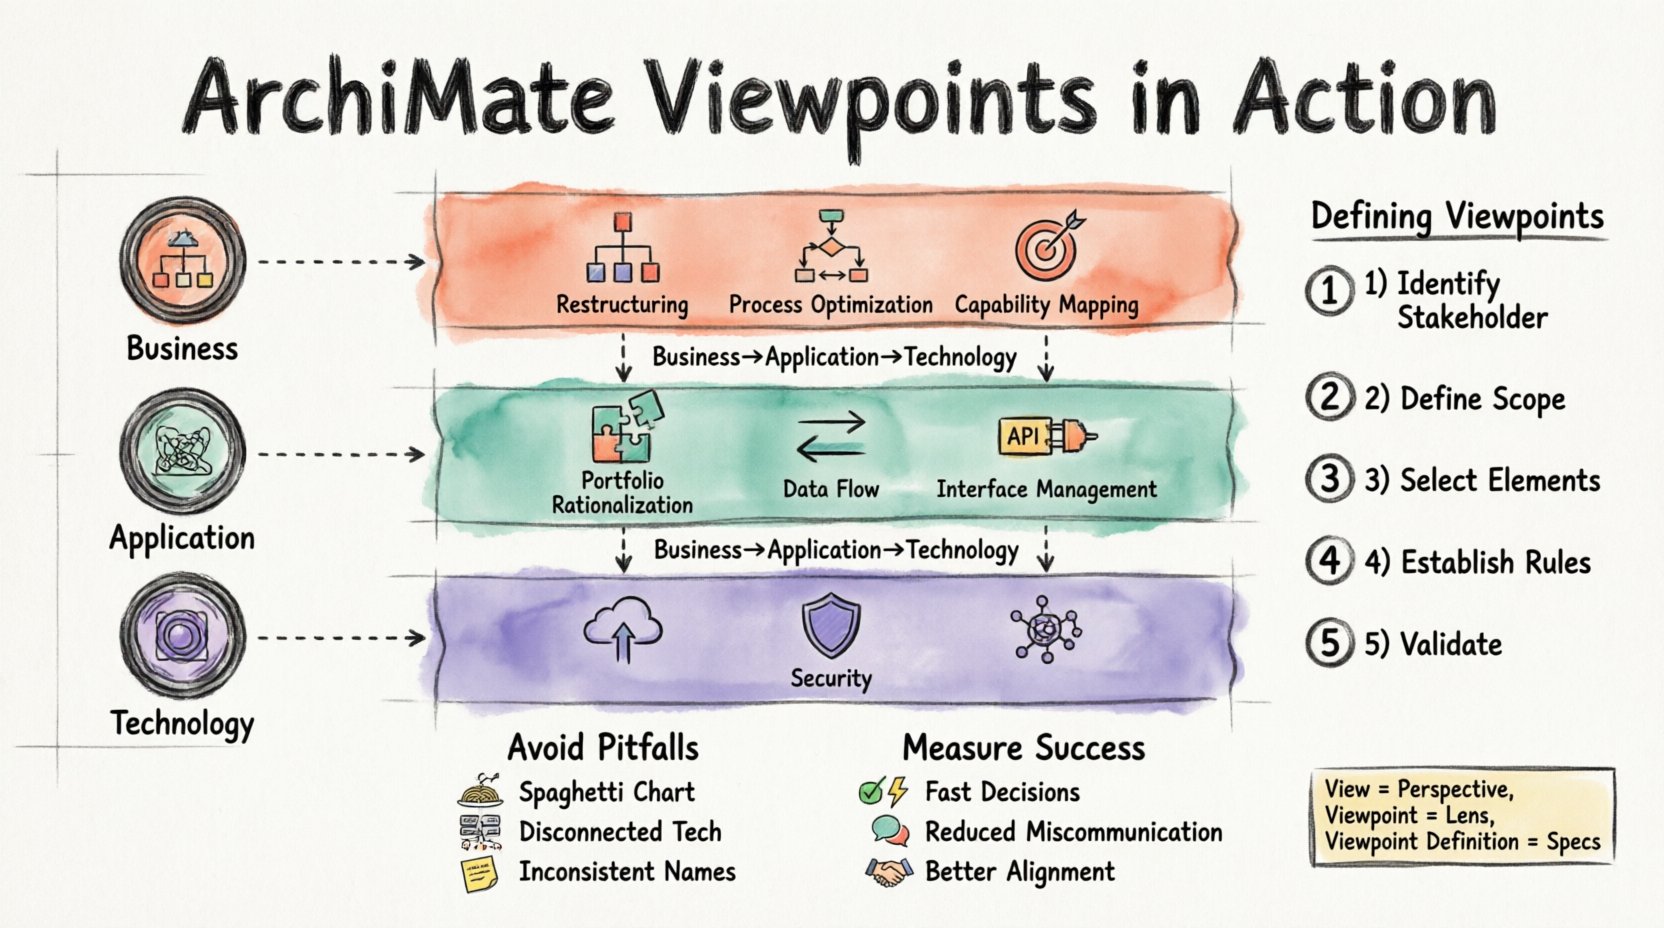
Before diving into specific layers, it is vital to understand the relationship between View, Viewpoint, and Viewpoint Definition. An Enterprise Architecture model is a comprehensive representation of the organization. However, presenting the entire model to a single audience is inefficient.
- View: A representation of a system from the perspective of a specific stakeholder.
- Viewpoint: The conventions used to construct the view. It defines the modeling language, notation, and rules.
- Viewpoint Definition: A formal specification of the viewpoint.
Think of a Viewpoint as a specialized camera lens. A wide-angle lens captures the whole landscape (Business Layer), while a macro lens focuses on the fine details of the machinery (Technology Layer). Using the wrong lens confuses the observer. Using the right lens brings the subject into focus.
🏛️ The Three Pillars of ArchiMate
The ArchiMate methodology divides the enterprise into three primary layers. Each layer has its own vocabulary and relationships. Selecting the correct viewpoint depends on which layer you are interrogating.
| Layer | Primary Focus | Typical Stakeholders | Key Question Answered |
|---|---|---|---|
| Business Layer | Organization, processes, and capabilities | Business Managers, Executives, Process Owners | How do we deliver value to the customer? |
| Application Layer | Software systems and data management | Application Architects, Developers, IT Managers | Which systems support the business processes? |
| Technology Layer | Infrastructure and hardware | Infrastructure Engineers, Sysadmins, Network Architects | Where is the application hosted and how does it run? |
📋 Business Layer Viewpoints in Action
The Business Layer is the foundation of value creation. It describes what the organization does, who does it, and where it happens. Viewpoints here are crucial for aligning strategy with execution.
Scenario 1: Organizational Restructuring
When a company undergoes a merger or acquisition, the Business Layer model helps visualize the new structure. A Business Structure Viewpoint is ideal here.
- Goal: To map roles and actors to new departments.
- Elements Used: Business Role, Business Actor, Position, Organizational Unit.
- Relationships: Assignment (Role assigned to Actor), Aggregation (Unit composed of Units).
- Outcome: A clear chart showing that the “Marketing Manager” role now reports to the “VP of Sales” rather than the “VP of Product”.
Scenario 2: Process Optimization
Identifying bottlenecks requires a deep dive into workflows. The Business Process Viewpoint helps map the flow of activities.
- Goal: To understand the sequence of events required to fulfill a request.
- Elements Used: Business Process, Business Function, Business Object, Business Service.
- Relationships: Flow (Process flows to Process), Realization (Process realizes Service).
- Outcome: Identification of redundant approval steps that slow down the hiring process.
Scenario 3: Capability Mapping
Strategic planning requires knowing what the organization can do versus what it needs to do. The Business Capability Viewpoint addresses this gap.
- Goal: To assess current strengths and weaknesses.
- Elements Used: Business Capability, Business Role.
- Relationships: Specialization (Capability specialized into sub-capabilities).
- Outcome: A heat map showing that “Customer Support” is a strong capability, while “Predictive Analytics” is currently missing.
📱 Application Layer Viewpoints in Action
The Application Layer represents the software systems that automate the business processes. These viewpoints are technical but focus on software functionality rather than hardware implementation.
Scenario 1: Application Portfolio Rationalization
Organizations often accumulate redundant software. A Application Portfolio Viewpoint helps clean up the estate.
- Goal: To identify duplicate systems and plan for retirement.
- Elements Used: Application Component, Application Interface, Application Function.
- Relationships: Communication (System A talks to System B), Realization (Component realizes Function).
- Outcome: Discovery that two different departments are using separate CRM tools that should be consolidated.
Scenario 2: Data Flow Analysis
Understanding how data moves between systems is critical for integration projects. The Data Flow Viewpoint tracks this movement.
- Goal: To ensure data integrity during system migration.
- Elements Used: Application Component, Data Object.
- Relationships: Association (Component uses Data Object).
- Outcome: A map showing exactly which legacy systems feed data into the new ERP system.
Scenario 3: Interface Management
APIs and integrations are the glue of modern IT. A Application Interaction Viewpoint highlights these connections.
- Goal: To manage dependencies and prevent breakage.
- Elements Used: Application Interface, Application Function.
- Relationships: Service Realization (Interface realizes Service).
- Outcome: Identification of critical interfaces that require high availability monitoring.
💻 Technology Layer Viewpoints in Action
The Technology Layer describes the physical and logical infrastructure. This is where the rubber meets the road. These viewpoints are often the most detailed and are critical for operations.
Scenario 1: Cloud Migration Planning
Moving from on-premise servers to the cloud requires a precise map of the current environment. A Deployment Viewpoint is essential.
- Goal: To map software components to physical nodes.
- Elements Used: Deployment Node, System Software, Device.
- Relationships: Deployment (Software deployed on Node).
- Outcome: A clear plan showing which virtual machines will host the application after the migration.
Scenario 2: Infrastructure Security
Securing the infrastructure requires knowing where the vulnerabilities lie. A Technology Infrastructure Viewpoint focuses on the devices.
- Goal: To assess hardware risks and patch requirements.
- Elements Used: Device, Network, Communication Network.
- Relationships: Access (Device accesses Network).
- Outcome: Identification of legacy devices that no longer receive security updates.
Scenario 3: Network Topology
Network engineers need to understand how data travels. The Network Viewpoint maps the connectivity.
- Goal: To optimize bandwidth and latency.
- Elements Used: Communication Network, Network Component.
- Relationships: Aggregation (Network composed of Components).
- Outcome: Visualization of single points of failure in the data center network.
🔗 Cross-Layer Connectivity
While layers are distinct, the enterprise is a unified system. Information must flow vertically. A Technology to Application relationship is common, where a Deployment Node hosts an Application Component. Similarly, an Application to Business relationship shows which software supports which business process.
When creating cross-layer views, keep the following in mind:
- Maintain Consistency: Do not change the name of a Business Process in the top layer and the Application Layer. Use consistent identifiers.
- Control Complexity: Do not dump all layers into one diagram. Use a layered approach where the Business Layer is the context, and subsequent layers zoom in.
- Focus on Value: Always tie the technical implementation back to a business outcome. Why are we adding this node? To support which capability?
🛠️ Defining Your Viewpoints Effectively
Creating a viewpoint is not just about picking a template. It is about defining the scope for a specific audience. Follow these steps to define a robust viewpoint.
Step 1: Identify the Stakeholder
Who is looking at this? A CTO needs different information than a CFO. Define the role clearly.
Step 2: Define the Scope
What part of the enterprise is relevant? Is it the entire organization or just the North American division? Define the boundaries.
Step 3: Select the Elements
Pick only the ArchiMate elements that matter. If the audience does not care about Business Objects, do not include them. Remove noise.
Step 4: Establish the Rules
Define the notation rules. Should all roles be colored blue? Should process steps be numbered? Consistency aids comprehension.
Step 5: Validate with the Audience
Show the draft viewpoint to the stakeholder. Ask if it answers their questions. If they find it confusing, iterate.
⚠️ Common Pitfalls to Avoid
Even experienced architects make mistakes when defining views. Be aware of these common traps.
- Overloading the Diagram: Trying to show everything results in a spaghetti chart. Keep diagrams focused.
- Ignoring the Business Context: Technical diagrams without business context are useless to decision-makers. Always link tech to business.
- Inconsistent Naming: Using “Server A” in one view and “Web Server” in another creates confusion. Standardize your glossary.
- Static Models: Architecture changes. If the model is not updated regularly, it becomes a relic. Treat the model as living documentation.
- Lack of Traceability: If you cannot trace a technology node back to a business goal, question its existence. If it does not serve a goal, it is technical debt.
📈 Measuring Success
How do you know your viewpoint strategy is working? Look for these indicators.
- Faster Decision Making: Stakeholders understand the implications of changes quickly.
- Reduced Miscommunication: Fewer meetings are needed to clarify basic structural questions.
- Better Alignment: IT projects align more closely with business strategy.
- Improved Agility: The organization can pivot faster because the architecture is understood.
🚀 Moving Forward
ArchiMate Viewpoints are tools for communication. They translate complex reality into understandable visuals. By applying the right lens to the right layer, you empower your organization to navigate change effectively. Whether you are optimizing a business process, migrating a data center, or rationalizing an application portfolio, the structured approach of ArchiMate provides the necessary clarity.
Start by auditing your current models. Are they serving the stakeholders, or are they just sitting in a repository? Refine your viewpoints to match the needs of your audience. Focus on the layers that matter most to your current challenges. With discipline and clarity, your architecture becomes a strategic asset rather than a bureaucratic burden.