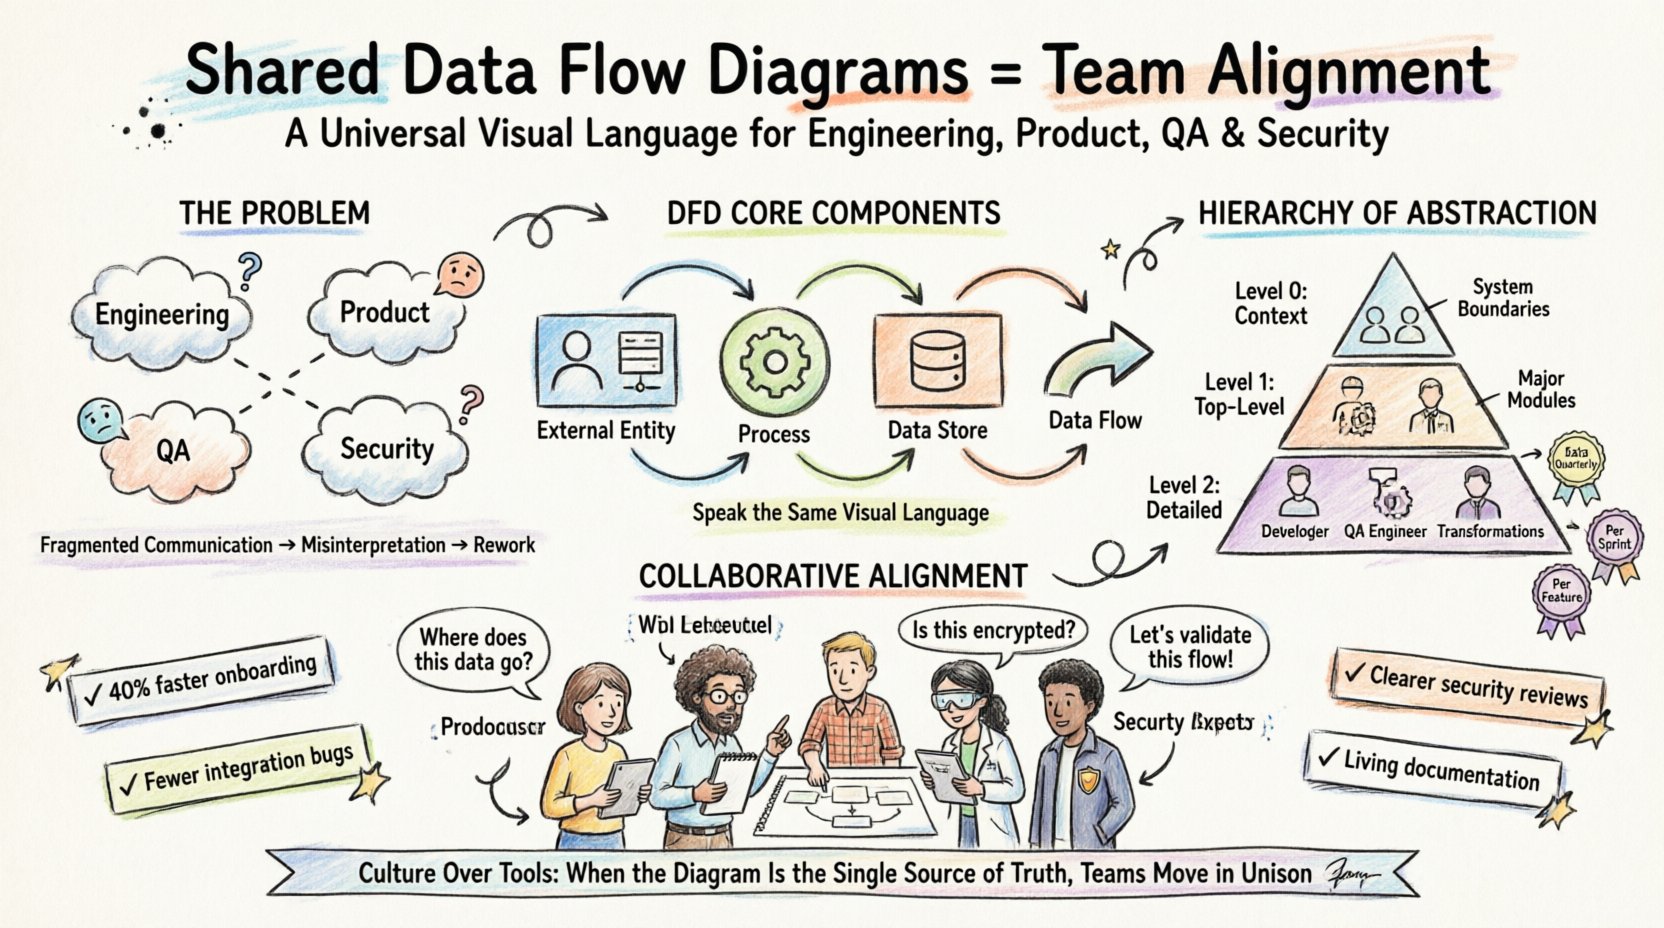
In modern software development and system architecture, the disconnect between teams is often a silent productivity killer. Engineering, product management, quality assurance, and security operations frequently operate in isolation, relying on fragmented documentation or verbal handoffs that lead to misinterpretation. A shared Data Flow Diagram (DFD) serves as a universal visual language that bridges these gaps. By establishing a common reference point, organizations can ensure that every stakeholder understands how data moves through the system, where it is stored, and how it transforms.
This guide explores the mechanics of implementing shared DFDs to foster alignment. It moves beyond simple diagramming to discuss the cultural and procedural shifts required to make these artifacts living documents that drive decision-making. We will examine the structural components of DFDs, the hierarchy of abstraction, and the governance models necessary to maintain their relevance over time.
What is a Data Flow Diagram? 🔍
A Data Flow Diagram is a graphical representation of the flow of data through an information system. Unlike a flowchart, which focuses on the sequence of logic or control flow, a DFD focuses on the data itself. It maps out where data originates, how it is processed, where it is stored, and where it exits the system.
The primary value of a DFD lies in its ability to abstract complexity. It allows stakeholders to see the “big picture” without getting bogged down in code-level implementation details. When teams share these diagrams, they align on the architecture before a single line of code is written.
Core Components of a DFD 🧩
To achieve true alignment, every team member must speak the same visual language. The standard notation for DFDs includes four fundamental elements:
- External Entity (Source/Sink): Represents a person, system, or organization outside the boundary of the system that sends or receives data. These are often depicted as rectangles.
- Process: Represents a transformation or action performed on the data. This is where input data is converted into output data. Processes are usually shown as rounded rectangles or circles.
- Data Store: Represents a repository where data is held for later use. This could be a database, a file system, or a temporary cache. Data stores are typically open-ended rectangles.
- Data Flow: Represents the movement of data between entities, processes, and stores. These are depicted as arrows with labels describing the information being moved.
When these components are standardized across an organization, a junior developer can look at a diagram created by a senior architect and understand the intent immediately. This reduces the cognitive load during code reviews and sprint planning.
Why Alignment Fails Without Shared Context 🚧
Without a centralized visual representation, teams often rely on textual requirements or verbal explanations. Text is linear and prone to ambiguity. A sentence describing a data validation rule might be interpreted differently by the backend team than by the frontend team. This leads to the “I thought you meant that” syndrome, resulting in rework and delayed releases.
The Cost of Misalignment 💸
When data flows are not clearly defined, several operational issues arise:
- Integration Failures: API contracts may not match the expected data structures.
- Security Gaps: Sensitive data might be passed through processes that do not encrypt it if the flow was not explicitly marked.
- Performance Bottlenecks: Teams may not realize that a specific data flow involves heavy processing, leading to latency issues in production.
- Onboarding Friction: New hires spend weeks trying to reverse-engineer the system instead of studying the architecture.
A shared DFD mitigates these risks by making the data movement explicit. It forces the team to answer the question: “Where does this data go next?” before the implementation begins.
Standardizing the DFD Hierarchy 📊
To prevent confusion, it is essential to adopt a hierarchical approach to diagramming. This allows different teams to engage with the level of detail appropriate to their role. A Product Manager needs to see the high-level flow, while an Engineer needs to see the specific data transformations.
Levels of Abstraction
- Level 0 (Context Diagram): This is the highest level. It shows the entire system as a single process and its interaction with external entities. It defines the boundaries of the system.
- Level 1 (Top-Level Decomposition): The main process is broken down into major sub-processes. This provides a functional overview of the system.
- Level 2 (Detailed Decomposition): Sub-processes are further broken down into specific actions. This is where the detailed logic resides.
The table below outlines the appropriate audience and purpose for each level.
| Diagram Level | Primary Audience | Focus Area | Update Frequency |
|---|---|---|---|
| Context (Level 0) | Stakeholders, Product, Management | System Boundaries & Inputs/Outputs | Quarterly or Major Release |
| Top-Level (Level 1) | Engineering Leads, Architects | Major Functional Modules | Per Sprint or Milestone |
| Detail (Level 2) | Developers, QA, Security | Specific Data Transformations | Per Feature Change |
Roles in the Alignment Process 👥
Creating and maintaining DFDs is not solely the responsibility of the technical team. Effective alignment requires input from various disciplines. Each role contributes a unique perspective that ensures the diagram reflects reality.
- Product Management: Defines the business value and the external entities. They ensure the diagram reflects user needs and business rules.
- System Architects: Define the high-level structure. They ensure the data stores and processes align with non-functional requirements like scalability and reliability.
- Backend Engineers: Validate the processing logic. They confirm that the defined data flows are technically feasible within the current infrastructure.
- QA Engineers: Identify edge cases. They review the diagram for missing data paths that could lead to untested scenarios.
- Security Specialists: Review data stores and flows for sensitive information. They ensure compliance with data protection regulations.
Collaborative Review Sessions 🤝
Instead of handing off a document, teams should hold workshops where the diagram is drawn or updated live. This technique, often called “whiteboarding,” encourages immediate feedback. If a security specialist notices a data flow leaving the system without encryption, they can flag it immediately rather than finding it during a code audit.
Establishing a Single Source of Truth 🏛️
A diagram is only useful if it is accessible and current. If a diagram exists on a local hard drive or in a static PDF, it becomes obsolete the moment a change occurs. To maintain alignment, the DFD must live in a centralized repository accessible to all authorized personnel.
Version Control for Diagrams 📝
Just as code is versioned, diagrams should be treated as code. This means storing diagram definitions in a version control system rather than relying on binary files that cannot be diffed. When using collaborative platforms, the system should track:
- Who made the change?
- When was the change made?
- What specific element was modified?
- What was the rationale for the change?
This audit trail is crucial for troubleshooting. If a bug appears in production, the team can look back at the diagram history to see if the data flow was altered recently.
Naming Conventions 🏷️
Ambiguity in naming destroys alignment. A process named “Update Data” is vague. A process named “Update User Profile Address” is precise. Establishing a strict naming convention for all processes, data stores, and flows is a prerequisite for a shared understanding.
- Process Names: Verb + Noun (e.g., “Validate Payment Details”).
- Data Stores: Plural Noun (e.g., “User Accounts”).
- Data Flows: Noun Phrase (e.g., “Order Confirmation Email”).
Maintenance and Evolution 🔄
One of the biggest challenges in documentation is keeping it up to date. In agile environments, changes happen frequently. If the diagram is not updated alongside the code, it becomes a liability rather than an asset.
Change Management Protocols 📋
Organizations should integrate diagram updates into their development workflow. A change to the data flow should be a prerequisite for a code merge. This can be enforced through:
- Definition of Done: A feature is not considered complete until the relevant DFD level is updated.
- Automated Checks: Scripts that verify if the diagram matches the deployed configuration.
- Regular Audits: Scheduled reviews where teams walk through the diagram to identify drift.
Handling Legacy Systems 🏗️
When working with existing systems, “as-is” diagrams must be created before “to-be” diagrams. Reverse engineering the current data flow is often the first step in a migration or refactoring project. This requires interviewing the original developers or analyzing the database schema to reconstruct the flow accurately.
Common Pitfalls to Avoid ⚠️
Even with the best intentions, teams can fall into traps that reduce the effectiveness of DFDs. Being aware of these common errors helps maintain the integrity of the alignment process.
Pitfall 1: Over-Complication 🧨
Attempting to show every single variable or error condition in a Level 0 or Level 1 diagram creates noise. The purpose of the diagram is to show the flow, not the logic. Detailed logic belongs in the code or in separate specification documents. Keep the visual representation clean.
Pitfall 2: Ignoring Non-Functional Requirements 🛡️
Standard DFDs often focus on functional data. However, security and performance data are also flows. Metadata, logs, authentication tokens, and audit trails must be included if they impact the system’s behavior. If a data flow carries sensitive information, it should be visually distinguished.
Pitfall 3: Creating “Shelf-Ware” 📚
If no one looks at the diagram during a meeting or a code review, it is shelf-ware. To prevent this, the diagram must be referenced explicitly in documentation. For example, when writing an API spec, link to the specific process in the DFD that handles that endpoint.
Measuring Success 📈
How do you know if shared DFDs are actually improving alignment? You need to track specific metrics that reflect collaboration and efficiency.
- Onboarding Time: Measure the time it takes for a new engineer to become productive. A clear DFD should reduce this significantly.
- Defect Density: Track the number of bugs related to data handling or integration. Fewer bugs suggest better alignment on data flows.
- Review Cycle Time: Monitor how long code reviews take. If reviewers understand the data flow from the diagram, they spend less time asking clarifying questions.
- Documentation Freshness: Calculate the ratio of diagrams that have been updated in the last sprint versus those that are stale.
Conclusion: Culture Over Tools 🧱
While the mechanics of Data Flow Diagrams are technical, their success depends on culture. Alignment is not achieved by forcing a specific tool on the team. It is achieved by agreeing that the diagram represents the truth.
When teams prioritize shared understanding over individual output, the quality of the software improves. The DFD becomes a contract between the product vision and the engineering execution. It ensures that the system built is the system designed, and the system designed is the system needed.
By adhering to the standards of hierarchy, versioning, and review, organizations can turn a static diagram into a dynamic tool for collaboration. The result is a more resilient architecture and a team that moves in unison.
Start by mapping your current state. Identify the silos. Draw the lines. Then, work together to make the flow clear. That is the path to alignment.