In the landscape of system design and requirements engineering, clarity is paramount. When stakeholders struggle to visualize how information moves through a system, projects often stall. This is where the Data Flow Diagram (DFD) becomes an essential instrument for business analysts. Unlike static charts or complex code, a DFD maps the journey of data from entry to exit, highlighting transformations and storage points. This guide explores the mechanics of DFDs, their structural components, and their critical role in successful business analysis.
Whether you are mapping a legacy system or designing a new digital platform, understanding the flow of information is the backbone of effective modeling. We will cover the core symbols, the hierarchy of diagrams, and the specific rules that ensure accuracy. No hype, just the structural integrity required for robust system documentation.
What is a Data Flow Diagram? 🤔
A Data Flow Diagram is a graphical representation of the flow of data through an information system. It models how data is processed by a system by showing its inputs and outputs. Unlike a flowchart, which focuses on the logic and decision-making sequence of a process, a DFD focuses on the data itself.
Key characteristics include:
- Focus on Data: It tracks data objects, not control logic.
- Process-Oriented: It shows how data changes as it moves through the system.
- Abstraction: It hides internal implementation details, focusing on the “what” rather than the “how”.
- Independence: It describes the system requirements without tying them to specific technology.
For a business analyst, the DFD serves as a communication bridge. It translates technical requirements into a visual format that non-technical stakeholders can review and validate. This reduces ambiguity and ensures that everyone agrees on how the system handles information.
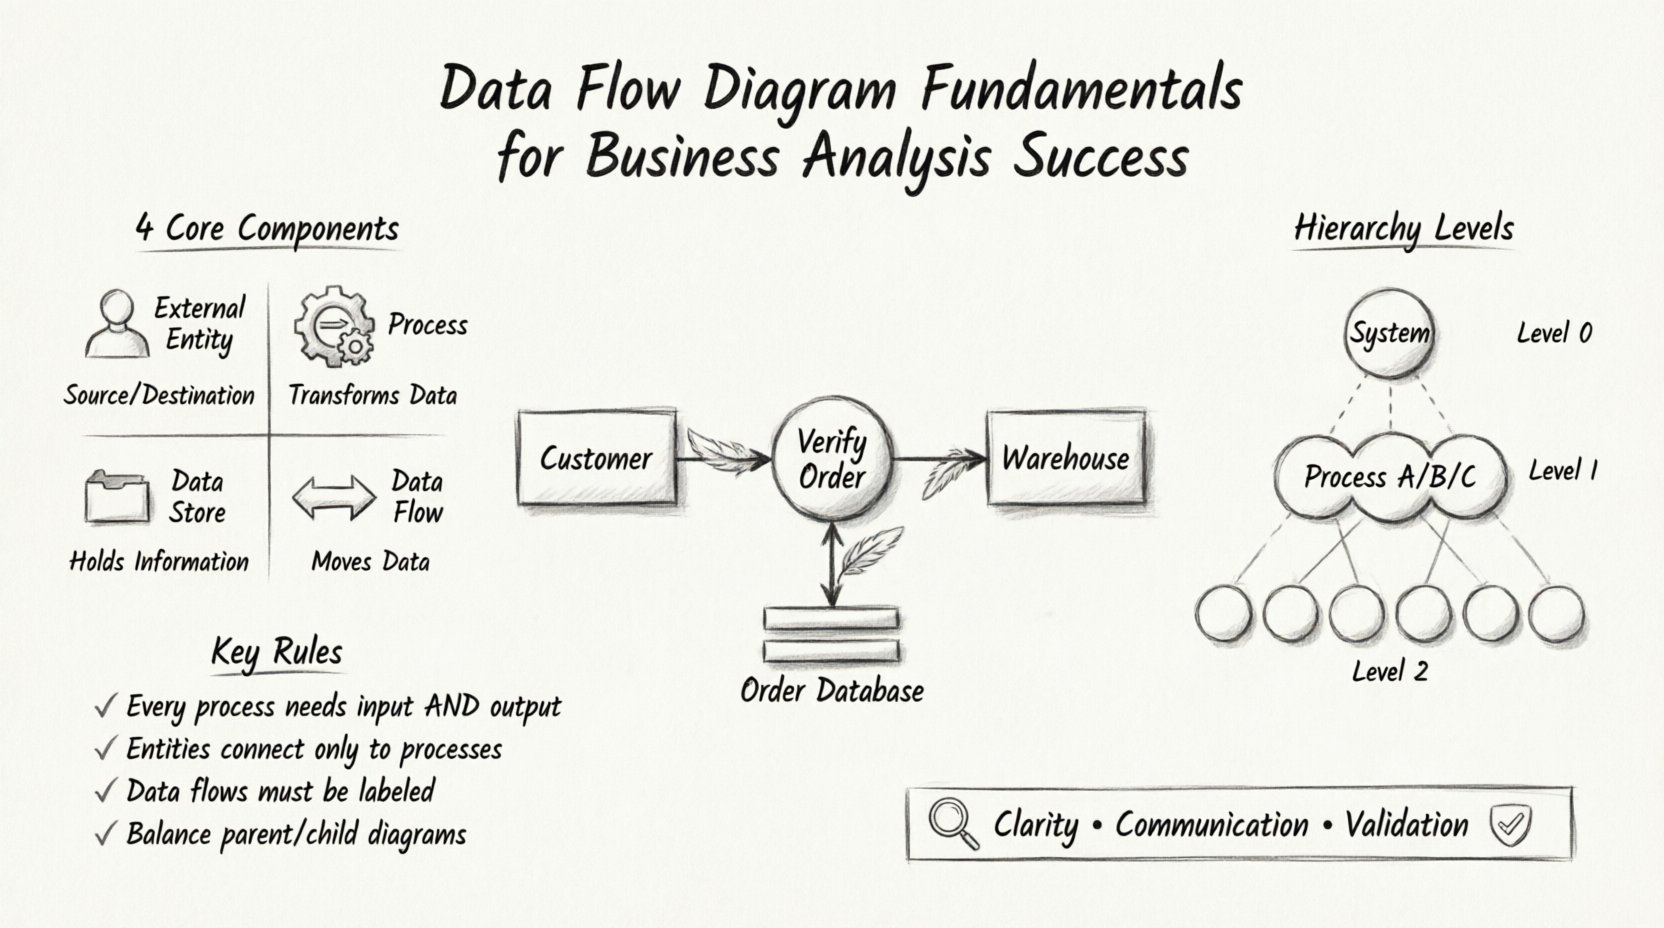
Core Components of a DFD 🧩
Every valid Data Flow Diagram consists of four fundamental elements. Understanding these is prerequisite to drawing accurate diagrams. These symbols remain consistent regardless of the method or tool used.
1. External Entities (Sources and Destinations) 👤
External entities represent people, organizations, or other systems that interact with the system being modeled. They act as the starting point (source) or the ending point (destination) for data flows. They exist outside the boundary of the system.
- Examples: A customer, a bank, a government agency, or a third-party API.
- Notation: Typically represented as a rectangle or an icon representing a person.
- Rule: Every data flow must connect to a process; it cannot connect directly to another entity.
2. Processes (Transformations) ⚙️
A process transforms incoming data into outgoing data. It describes a function, activity, or calculation performed on the data. This is where the “work” happens within the system.
- Examples: “Calculate Total,” “Verify User,” “Generate Report.”
- Notation: Usually a circle or a rounded rectangle.
- Rule: Every process must have at least one input and one output. A process that takes input but produces no output is impossible.
3. Data Stores (Repositories) 📁
Data stores represent where information is saved for later use. This could be a database, a file, a paper file, or a physical warehouse. It does not process data; it holds it.
- Examples: Customer Database, Inventory File, Order Log.
- Notation: Often an open-ended rectangle or parallel lines.
- Rule: Data flows must connect processes to data stores. A data store cannot connect directly to an external entity.
4. Data Flows (Movement) 🔄
Data flows indicate the movement of data between entities, processes, and stores. They represent the actual data packets being transmitted.
- Examples: “Invoice,” “Payment Details,” “Search Query.”
- Notation: An arrow pointing in the direction of data movement.
- Rule: Arrows must be labeled. Unlabeled flows are meaningless.
The table below summarizes the relationships between these components to aid in quick reference.
| Component | Function | Connection Rule |
|---|---|---|
| External Entity | Source or Destination | Connects only to a Process |
| Process | Transforms Data | Connects to Entities, Stores, and other Processes |
| Data Store | Stores Data | Connects only to a Process |
| Data Flow | Transports Data | Must be labeled; cannot connect Entity to Entity directly |
Levels of DFD Decomposition 📉
A single diagram rarely captures the entire complexity of a system. To manage detail, DFDs are decomposed into different levels. This hierarchy allows analysts to zoom in and out of the system view.
Context Diagram (Level 0) 🌍
The Context Diagram is the highest level of abstraction. It shows the system as a single process and identifies the external entities that interact with it. It defines the boundaries of the system.
- Scope: One central process representing the entire system.
- Detail: Only major data inputs and outputs are shown.
- Usage: Used for initial stakeholder agreement on system scope.
Level 1 Diagram 🏗️
The Level 1 diagram expands the single process from the Context Diagram into sub-processes. It breaks down the major functions of the system.
- Scope: Internal processes of the system are visible.
- Detail: Shows how data moves between internal functions.
- Usage: Used for detailed functional requirements.
Level 2 and Beyond 🧱
Further decomposition occurs if a process in Level 1 is still too complex. A Level 2 diagram breaks down a specific Level 1 process into finer steps.
- Scope: Detailed logic within a specific function.
- Detail: Specific data transformations and local stores.
- Usage: Used for development teams implementing specific modules.
The Principle of Balancing ⚖️
One of the most critical rules in DFD modeling is balancing. Balancing ensures consistency between a parent diagram and its child diagram. When a process is exploded into a lower-level diagram, the inputs and outputs must remain the same.
If a Level 0 process receives “Order Data” and sends “Receipt Data,” the Level 1 diagram representing that process must also receive “Order Data” as input and send “Receipt Data” as output. The internal complexity changes, but the interface to the outside world remains constant. This ensures that no data is created or destroyed during the decomposition process.
Step-by-Step Creation Process 🛠️
Creating a robust DFD requires a structured approach. Rushing leads to errors and confusion. Follow these steps to build a reliable model.
1. Identify the System Boundary
Define what is inside the system and what is outside. This determines which entities are external and which processes are internal. Everything outside this boundary is an External Entity.
2. Map External Entities
List all people, departments, or systems that interact with the solution. Place them on the periphery of your diagram. Do not include internal users unless they act as external sources of data.
3. Define Major Processes
Identify the high-level functions required to handle the data. Use action verbs for names (e.g., “Process Payment” rather than “Payment”). Ensure there is a logical sequence.
4. Draw Data Flows
Connect entities to processes and processes to data stores. Ensure every flow has a label describing the data moving through it. Avoid crossing lines where possible to maintain readability.
5. Review and Validate
Check against the balancing rule. Verify that every process has inputs and outputs. Ensure no data store is accessed without a process in between. Present the draft to stakeholders for feedback.
Naming Conventions for Clarity 🏷️
A diagram with messy labels defeats its purpose. Clear naming conventions reduce cognitive load for the reader.
Process Names
- Use a verb followed by a noun (e.g., “Update Customer Profile”).
- Keep names short but descriptive.
- Avoid generic terms like “Process 1” or “Do Something”.
Data Flow Names
- Name the data itself, not the action (e.g., “Invoice Details” not “Send Invoice”).
- Use singular or plural consistently across the diagram.
- Ensure the name matches the data dictionary or requirements document.
Data Store Names
- Use a noun phrase indicating what is stored (e.g., “Order File” or “Customer List”).
- Do not use verb phrases.
Common Pitfalls and How to Avoid Them ⚠️
Even experienced analysts make mistakes. Recognizing common errors early saves significant rework later.
1. Dangling Data Flows
A flow that starts or ends in nowhere. Every arrow must connect two valid components.
- Fix: Trace every line. If it ends in empty space, connect it to a process or entity.
2. Black Holes
A process that has input but no output. This implies data is consumed without being used or stored.
- Fix: Ensure every process generates some form of output, whether to a store, an entity, or another process.
3. Miracle Processes
A process that has output but no input. This implies data appears out of thin air.
- Fix: Identify the source of the data. Connect it to an entity or a data store.
4. Direct Entity-to-Entity Flows
Data cannot move from one external entity to another without passing through the system (process).
- Fix: Route all external flows through at least one internal process.
5. Too Much Detail Too Soon
Starting with a Level 2 diagram without establishing the Context or Level 1 view.
- Fix: Start broad. Define the system boundary first. Decompose only when the high-level view is approved.
Integrating DFDs into Modern BA Practices 🔄
Data Flow Diagrams are not isolated artifacts. They fit into broader business analysis workflows, particularly in agile and iterative environments.
Agile Compatibility
In agile settings, heavy documentation is often discouraged. However, visual models like DFDs remain valuable for complex logic. They can be created as “just enough” documentation to guide development without becoming a bottleneck. Use them to clarify user stories that involve complex data transformations.
Requirements Traceability
Each process in a DFD should map to a functional requirement. This creates a traceability matrix where you can verify that every requirement is represented in the model. If a requirement exists that has no corresponding process, the system design is incomplete.
Stakeholder Communication
Technical jargon often alienates business users. DFDs provide a universal language. A business user can point to a data store and say, “Where do we keep this history?” The analyst can then verify if a store exists in the diagram. This facilitates collaborative refinement of requirements.
Validation Techniques for Accuracy 📏
Once a diagram is drawn, it must be tested. Validating a DFD ensures it accurately reflects the real-world operations.
Walkthroughs
Conduct a walkthrough with subject matter experts. Trace a specific transaction through the diagram. For example, trace the lifecycle of a “Purchase Order” from creation to archiving. If the path is broken or illogical, the diagram needs revision.
Data Dictionary Cross-Reference
Compare the labels on your data flows with your data dictionary. Ensure that the data structure defined in the dictionary matches the data being moved in the diagram. If the dictionary defines “Customer ID” as a string but the flow implies a number, there is a discrepancy.
Consistency Checks
Check for consistency across multiple diagrams. If a process appears in a Level 1 diagram, the data flows entering and leaving it must match the flows in the Level 2 decomposition. Inconsistencies here indicate gaps in logic.
The Role of Data Stores in Analysis 🗃️
Data stores are often overlooked, yet they represent the state of the system. Understanding them is vital for data governance and integrity.
Read vs. Write Operations
Not all connections to a data store are the same. Some processes merely read data (e.g., “Display History”), while others write or update data (e.g., “Save Order”). While traditional DFDs use a single line for both, understanding the distinction helps in database design later. A read-only store does not require write permissions for that specific user.
Temporary vs. Permanent Storage
Distinguish between temporary buffers and permanent archives. A temporary store might hold data during a batch calculation, while a permanent store retains it for compliance. This distinction affects security requirements and retention policies.
Conclusion on DFD Utility 🚀
Data Flow Diagrams remain a timeless tool for business analysis. They strip away the noise of implementation details to reveal the core movement of information. By adhering to strict rules regarding components, balancing, and naming, analysts can create models that serve as reliable blueprints for system development.
Success in business analysis depends on clarity. A well-constructed DFD provides that clarity. It aligns stakeholders, guides developers, and ensures that the final system behaves as intended. When used correctly, the DFD is not just a drawing; it is a contract between the business needs and the technical solution.
Focus on the data. Respect the boundaries. Validate the flows. This disciplined approach will yield diagrams that stand the test of time and change.