In modern software architecture, understanding how information moves is as critical as understanding how it is stored. A Data Flow Diagram (DFD) serves as the blueprint for this movement, mapping the journey of data from input to output. When designing systems intended to handle growth, these diagrams evolve from simple sketches into complex maps that dictate performance, reliability, and maintainability. This guide explores the essential patterns used to model data flows in scalable environments.
Scalability is not merely about adding more servers; it is about restructuring how data traverses the system to avoid bottlenecks. By applying specific DFD patterns, architects can visualize capacity limits before they become production issues. This approach ensures that the logical flow of information supports both current requirements and future expansion.
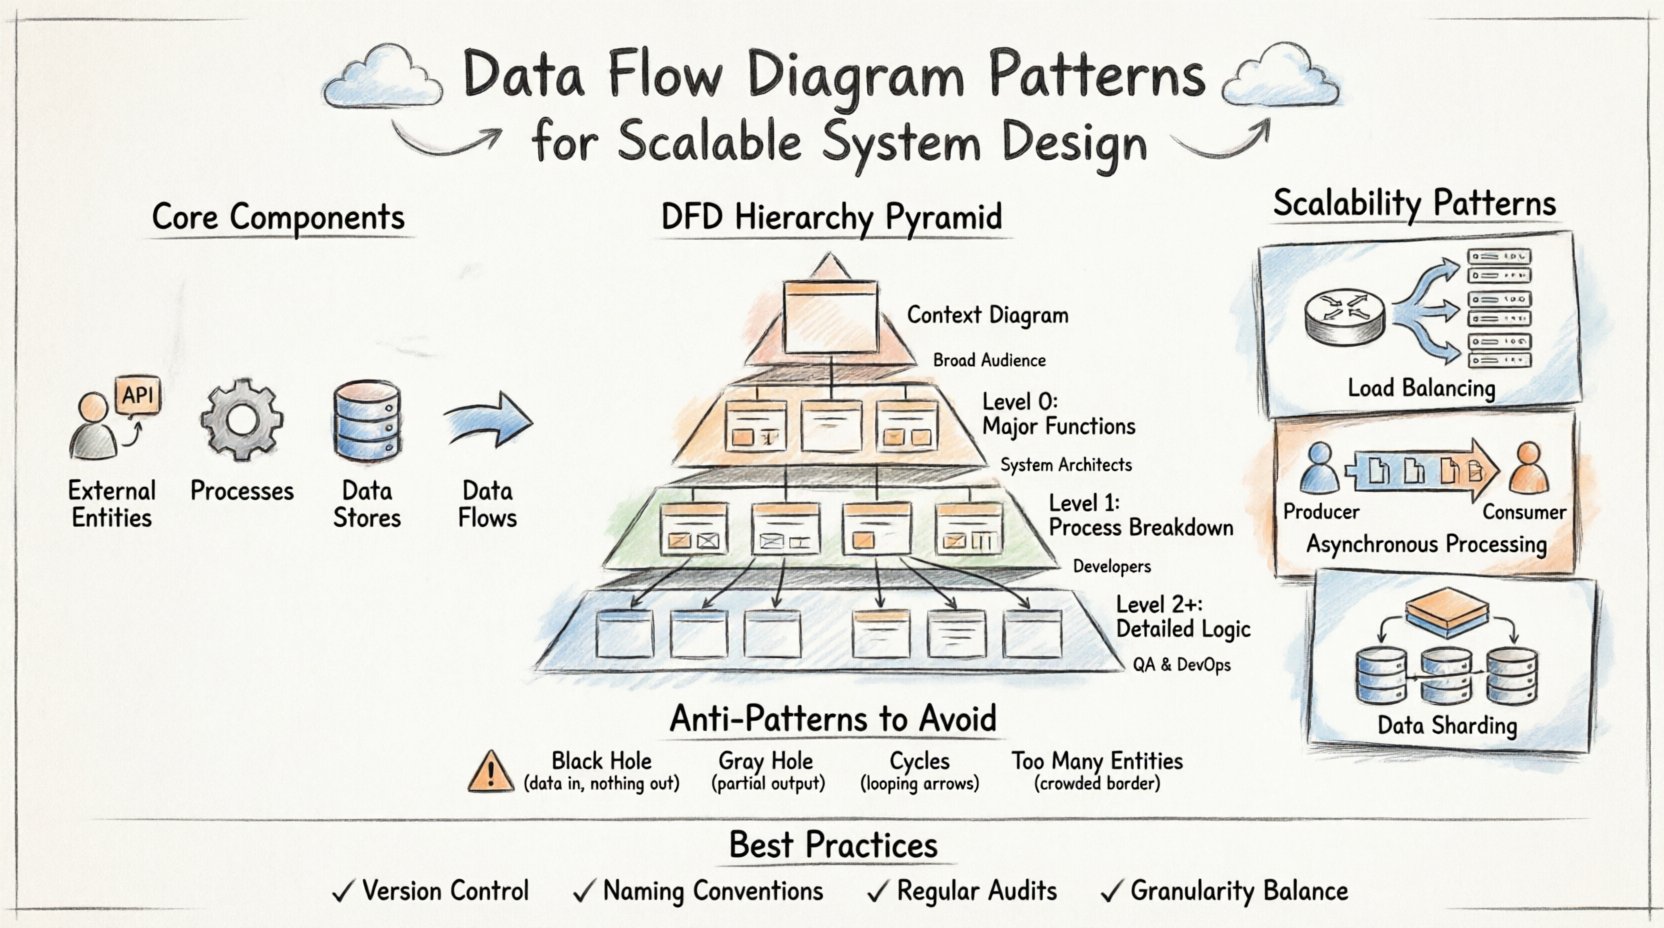
🧩 Core Components of a Data Flow Diagram
Before diving into patterns, one must master the building blocks. Every DFD relies on four fundamental elements. Confusing these leads to ambiguous models that fail to guide development effectively.
- External Entities: Represent sources or destinations outside the system boundary. These include users, third-party APIs, or hardware devices.
- Processes: Transform data from one form to another. These are the active computations or business logic points within the system.
- Data Stores: Locations where data rests at rest. These can be databases, file systems, or memory caches.
- Data Flows: The paths data takes between entities, processes, and stores. Arrows indicate direction and content.
Each component must be clearly defined to prevent ambiguity. For instance, a process should never have an arrow pointing to another process without a corresponding flow of data. Every arrow must represent actual information moving through the system.
📉 The Hierarchy of DFD Levels
Scalable systems require different levels of abstraction. A single diagram rarely captures the entire complexity. Instead, a hierarchy is used to drill down from high-level context to detailed implementation logic. This structure allows teams to review the big picture without getting lost in the weeds.
| Level | Focus | Complexity | Primary Audience |
|---|---|---|---|
| Context Diagram | System boundary and external interactions | Low | Stakeholders, Management |
| Level 0 (DFD 0) | Major system functions and data stores | Medium | System Architects |
| Level 1 | Breakdown of Level 0 processes | High | Developers, Engineers |
| Level 2+ | Specific algorithmic or sub-process logic | Very High | Specialized Engineers |
Maintaining consistency across these levels is vital. A data store identified in Level 0 must be referenced correctly in Level 1. If a process is split in Level 1, the input and output flows must match the parent process in Level 0. This balance ensures the model remains a reliable reference throughout the lifecycle.
🚀 Scalability Patterns in System Architecture
Designing for scale requires specific modeling choices. Standard diagrams often hide the load handling mechanisms. To address scalability, architects must explicitly represent patterns that distribute work or manage resources.
1. Load Balancing and Distribution
In high-traffic systems, a single process cannot handle all incoming requests. The DFD must reflect the distribution mechanism.
- Router Pattern: Introduce a process node that directs traffic to multiple service nodes.
- Replication: Show multiple identical processes receiving the same data flow for parallel processing.
- Queueing: Represent a data store that acts as a buffer before processing begins, smoothing out spikes.
When drawing a router, ensure the flow splits logically. If the system uses a round-robin strategy, the diagram should indicate that the decision is based on load rather than data content. This distinction impacts how the backend logic is implemented.
2. Asynchronous Processing
Synchronous flows can create bottlenecks if one step waits for another. Asynchronous patterns decouple processes, allowing the system to scale independently.
- Message Queues: Use a data store to represent a queue. The producer writes to the store, and the consumer reads from it later.
- Event Streams: Show a process emitting an event that triggers multiple downstream consumers without blocking the sender.
- Background Jobs: Separate long-running tasks from user-facing requests by routing them to a dedicated process pool.
This separation allows the user-facing processes to remain lightweight while heavy lifting occurs in the background. The DFD makes this separation visible, preventing developers from assuming immediate response times.
3. Data Sharding and Partitioning
As data volume grows, single storage units become performance barriers. Sharding patterns in DFDs help visualize how data is split across multiple stores.
- Horizontal Splits: Show a process routing specific data subsets to different data stores based on an ID or key.
- Read Replicas: Indicate separate flows for reading data from replicas while writes go to the primary store.
- Caching Layers: Insert a cache data store between the process and the main database to reduce latency.
| Pattern | Scalability Benefit | Trade-off |
|---|---|---|
| Load Balancing | Increases throughput | Increased complexity in state management |
| Asynchronous Queues | Decouples dependencies | Eventual consistency |
| Sharding | Expands storage capacity | Complex queries across shards |
| Caching | Reduces latency | Data staleness risks |
⚠️ Common Anti-Patterns to Avoid
Even with good intentions, DFDs can contain structural flaws that lead to system failures. Recognizing these anti-patterns early prevents costly refactoring later.
1. The Black Hole
A Black Hole occurs when a process receives data but produces no output. This often happens when a process is assumed to delete data or process it silently.
- Risk: Data loss without error notification.
- Fix: Ensure every input has a corresponding output flow or a clear error path.
- Scalability Impact: Silent failures are difficult to debug in distributed systems.
2. The Gray Hole
A Gray Hole is similar to a Black Hole but with a partial output. The process consumes more data than it produces, but does not explain where the rest went.
- Risk: Unexplained data consumption leads to storage leaks or transaction errors.
- Fix: Explicitly model all data paths, including error logs or audit trails.
3. Cycles in Data Flow
While some feedback loops are necessary (e.g., retry mechanisms), uncontrolled cycles can cause infinite processing loops.
- Risk: System hangs or resource exhaustion.
- Fix: Limit the depth of recursion in the diagram and implement timeout mechanisms in the design.
4. Infinite External Entities
Adding too many external entities makes the diagram unreadable and obscures the core logic.
- Risk: Loss of clarity on system boundaries.
- Fix: Group related entities into a single “System of Record” or “User Interface” entity where appropriate.
🔄 Best Practices for Maintenance and Evolution
A DFD is not a one-time artifact. It must evolve as the system grows. Keeping the model accurate ensures that new team members understand the architecture without reverse-engineering the code.
- Version Control: Treat diagrams like code. Store them in a repository to track changes over time.
- Naming Conventions: Use consistent naming for processes and data flows. “Update User” should always be “Update User,” not “Change User Details.”
- Regular Audits: Schedule periodic reviews to ensure the diagram matches the current implementation.
- Granularity Balance: Do not make every process a sub-process. Group related logic to maintain a manageable view of the system.
📝 Final Considerations
Effective system design relies on clear communication. The Data Flow Diagram provides a shared language between architects, developers, and stakeholders. By adhering to established patterns and avoiding common pitfalls, teams can build systems that grow gracefully.
Remember that diagrams are models, not the reality itself. They simplify complexity to make it understandable. However, the simplification must not remove critical details regarding data integrity and flow. When a DFD accurately reflects the data movement, it becomes a powerful tool for predicting bottlenecks and optimizing performance.
As systems become more distributed, the need for rigorous modeling increases. The patterns described here provide a foundation for that rigor. Whether designing a monolithic application or a microservices ecosystem, the principles of data flow remain constant. Focus on the movement of information, and the structure will follow.
Start with the Context Diagram. Define the boundaries clearly. Drill down into the processes only when necessary. Keep the focus on data, not on the technology stack. This discipline ensures that the architecture remains flexible and scalable for years to come.