In the landscape of modern business analysis, clarity is not merely a luxury; it is a necessity. Organizations grapple with workflows that span multiple departments, legacy systems, and human interactions. When complexity rises, the risk of miscommunication increases. This is where structured modeling techniques become essential. Specifically, the Data Flow Diagram (DFD) offers a robust method for visualizing how information moves through a system. By decomposing complex business processes, analysts can break down overwhelming tasks into manageable, logical components. This guide explores the mechanics, principles, and strategic application of DFDs in process decomposition.
Understanding the Foundation of Data Flow Diagrams 🧩
A Data Flow Diagram is a graphical representation of the flow of data through an information system. Unlike flowcharts, which often depict control logic or procedural steps, DFDs focus strictly on data. They illustrate where data originates, where it is stored, how it is transformed, and where it ultimately exits. This distinction is critical for business analysts who need to understand the substance of operations rather than just the sequence of events.
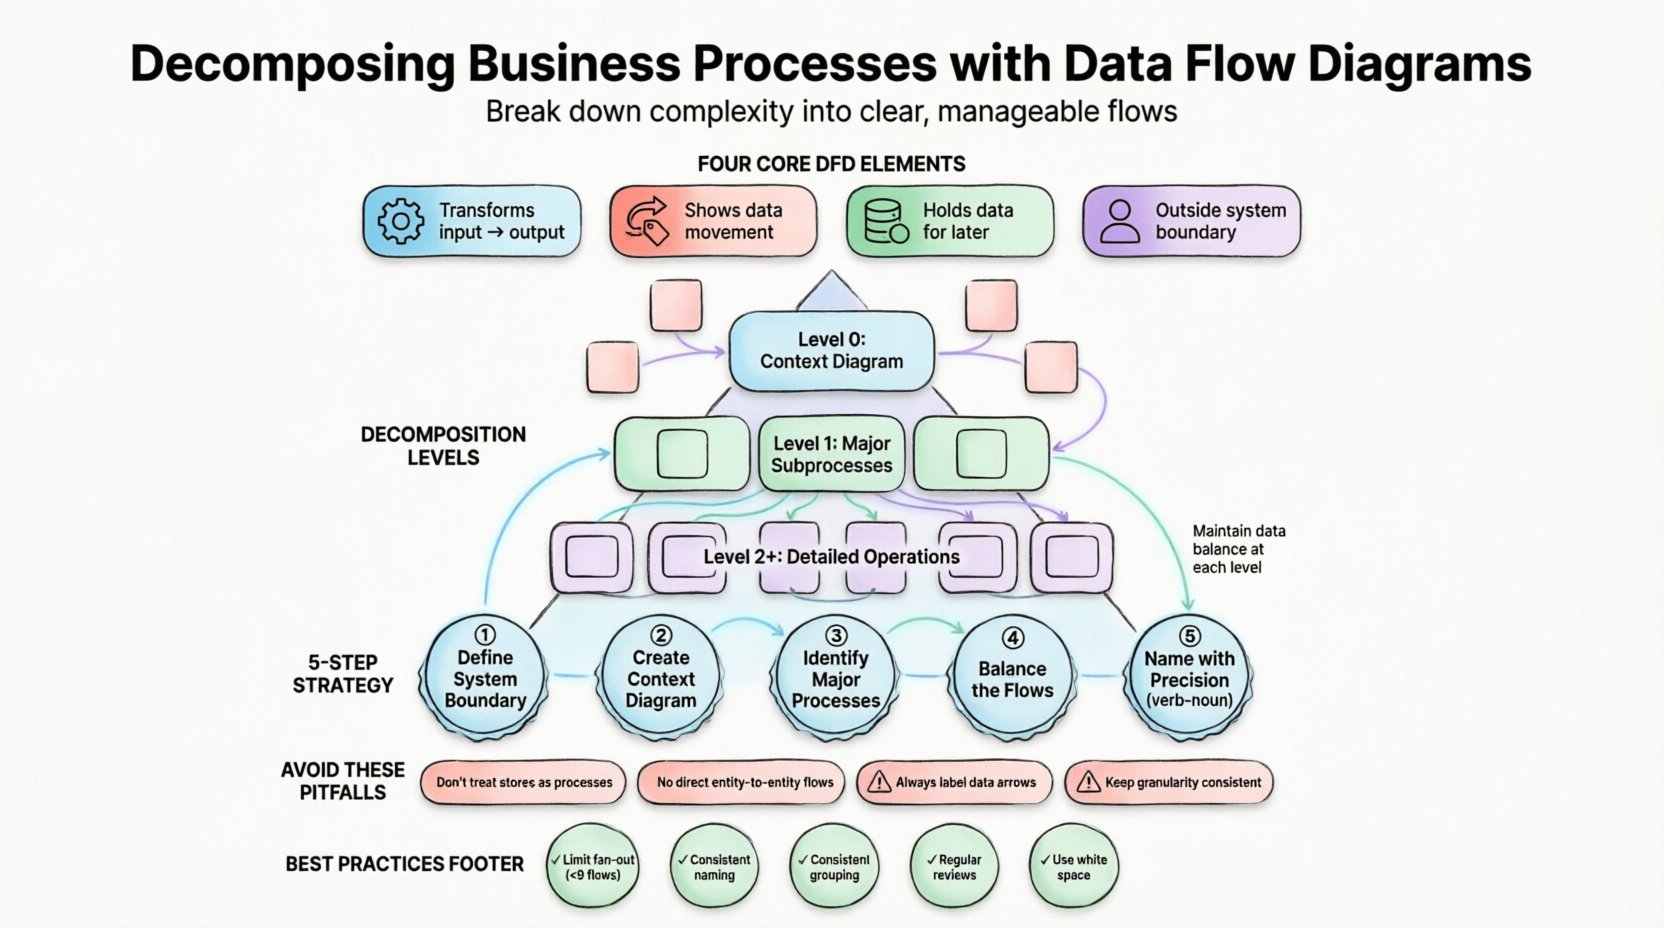
Structured DFDs rely on a specific notation to ensure consistency across the documentation. The diagram is built upon four primary elements:
- Processes: Actions that transform input data into output data. These are typically represented as rounded rectangles or circles. They describe what happens to the data.
- Data Flows: The movement of data between processes, stores, and entities. These are depicted as arrows and must be labeled clearly to indicate the content being moved.
- Data Stores: Places where data is held for later use. These are open-ended rectangles or parallel lines. They represent databases, files, or physical archives.
- External Entities: Sources or destinations of data outside the system boundary. These are squares or rectangles and represent users, other systems, or organizations.
Without a standardized approach, these diagrams can become chaotic. Structured DFDs impose a discipline that ensures every data flow has a source and a destination, and every process transforms data logically.
The Imperative of Decomposition 🔨
Complex business processes rarely fit on a single page. Attempting to map an entire enterprise operation in one view results in a diagram that is unintelligible to stakeholders. Decomposition is the technique used to break a high-level process into lower-level details. This hierarchical approach allows analysts to manage cognitive load and maintain precision.
Decomposition serves several critical functions:
- Granularity Control: It allows the team to zoom in on specific areas of concern without losing sight of the broader context.
- Stakeholder Alignment: Different stakeholders require different levels of detail. Executives may view the top-level diagram, while developers need the detailed subprocesses.
- Error Detection: Complex interactions become easier to spot when isolated. Data inconsistencies or missing flows are more visible at lower levels.
- Modularity: It encourages thinking in terms of discrete functions, which aligns well with modern software architecture and microservices.
The process of decomposition is not arbitrary. It follows a logical path where a parent process is expanded into child processes that collectively account for all the data entering and leaving the parent.
Levels of Decomposition in Structured DFDs 📈
To maintain structure, DFDs are typically organized into levels. This hierarchy ensures that the abstraction remains consistent as details are added. The following table outlines the standard levels of decomposition:
| Level | Common Name | Description |
|---|---|---|
| 0 | Context Diagram | Shows the entire system as a single process interacting with external entities. |
| 1 | Level 0 Diagram | Breaks the main process into major subprocesses (usually 3 to 9). |
| 2 | Level 1 Diagrams | Further decomposes specific Level 0 processes into detailed operations. |
| 3+ | Child Diagrams | Deep dive into complex logic for implementation details. |
Each level must adhere to the principle of data balance. This means that the inputs and outputs of a parent process must exactly match the combined inputs and outputs of its child processes. If a Level 0 process has an input of “Order Data,” the Level 1 subprocesses must collectively accept “Order Data” and cannot introduce new external inputs without justification.
Step-by-Step Decomposition Strategy 🚀
Executing a decomposition requires a methodical approach. Rushing into drawing arrows often leads to structural errors. The following workflow ensures a robust diagram structure.
1. Define the System Boundary
Before drawing anything, determine what is inside the system and what is outside. This boundary defines the scope of the project. External entities exist outside this boundary. Everything that happens within the boundary is a process or a store. This definition prevents scope creep during the analysis phase.
2. Create the Context Diagram
Start with the top-level view. Place the system as a single bubble in the center. Identify the major external entities that interact with it. Draw the major data flows between them. This diagram provides a “helicopter view” for stakeholders to confirm the scope.
3. Identify Major Processes
Look at the data flows entering and leaving the system. Each distinct transformation suggests a major process. For example, if “Customer Data” enters and “Invoice Data” leaves, the transformation is likely “Generate Invoice.” Group these into logical clusters.
4. Balance the Flows
As you decompose a process, verify the inputs and outputs. Ensure no data disappears (a black hole) and no data appears from nowhere (a miracle). Every arrow entering a subprocess must be accounted for by the data leaving it.
5. Name with Precision
Labeling is often overlooked but is critical for readability. Process names should be verb-noun phrases, such as “Validate Order” or “Calculate Tax.” Avoid vague labels like “Process Data.” The label must describe the specific transformation occurring.
Common Pitfalls in Process Modeling ⚠️
Even experienced analysts encounter issues when modeling data flows. Recognizing these patterns early can save significant rework. The following are common errors observed during decomposition.
Data Stores as Processes
It is tempting to treat a database as a process because data interacts with it. However, a database is a passive store. It does not transform data; it holds it. A process must have an action verb associated with it. A store is accessed by a process, not a process itself.
Connecting Entities Directly
Data cannot flow directly from one external entity to another without passing through the system. If a customer sends a request and receives a response, the data must enter a process, be transformed, and then exit. A direct line between two entities implies they are the same entity or the system is bypassed.
Unlabeled Data Flows
An arrow without a label is meaningless. It does not indicate what information is moving. Every flow must be named, such as “Shipping Address” or “Payment Status.” Ambiguity here leads to implementation errors later.
Inconsistent Granularity
One process might be detailed while a neighboring process is vague. This inconsistency confuses readers. If one subprocess is broken down into three steps, the adjacent processes should be at a comparable level of detail unless they are inherently simpler.
Integrating DFDs with Business Requirements 📝
A diagram is only useful if it maps to actual business needs. Data Flow Diagrams should not exist in a vacuum. They must serve as the visual backbone for requirements documentation. When a requirement states that “The system must validate credit cards,” the DFD should show a process for validation receiving card data and outputting a status flag.
This traceability is vital for auditing and compliance. In regulated industries, the ability to prove where data comes from and how it is protected is mandatory. The DFD provides the map for security reviews. Analysts can identify where sensitive data flows and ensure appropriate controls are applied at the process level.
Best Practices for Structured Modeling ✅
To maintain high quality in your diagrams, adhere to the following best practices. These guidelines promote consistency and ease of maintenance.
- Limit Fan-Out: Avoid connecting a single process to more than nine data flows. If a process is this complex, it likely needs to be decomposed further.
- Consistent Naming: Use the same terminology for data flows across all levels. If “Order Data” is used at Level 0, do not call it “Customer Request” at Level 1.
- Logical Grouping: Group related processes together. If a set of processes always handles financial data, keep them clustered visually to aid comprehension.
- Review Regularly: Business processes change. A DFD is a living document. Schedule periodic reviews to ensure the diagram reflects current operations.
- Use White Space: Do not cram elements together. Adequate spacing reduces cognitive load and makes the diagram easier to read.
The Role of Decomposition in System Design 🏗️
Beyond documentation, DFD decomposition influences how systems are built. When processes are clearly defined, development teams can assign modules to specific developers or teams. This modularity reduces dependency between teams. If Process A and Process B are independent, they can be developed in parallel.
Furthermore, decomposition aids in identifying performance bottlenecks. If a specific subprocess consumes excessive resources or introduces significant latency, it becomes a target for optimization. Without the decomposition, the bottleneck is hidden within the monolithic view of the system.
It also supports testing strategies. Test cases can be derived directly from the data flows. If a process converts “Input A” to “Output B,” a test case must verify that specific transformation. This alignment between design and testing ensures higher quality delivery.
Handling Concurrent Processes and Loops 🔄
Real-world business processes often involve loops and concurrent actions. A standard DFD represents logic linearly, but business rules can be iterative. For example, an order may require multiple verification steps before approval. In the diagram, this is represented by data flows that loop back to previous processes.
When modeling loops, clarity is paramount. Ensure the loop condition is documented in the process description, not just implied by the arrow. A flow returning to a process indicates a rework cycle or a validation retry. Explicitly stating the condition for this return prevents ambiguity for the development team.
Concurrent processes are represented by parallel flows. If two processes happen simultaneously, draw them on separate branches. However, remember that DFDs do not show timing or synchronization points. That level of detail belongs to other modeling notations. The DFD focuses on the existence of the flow, not the timing of it.
Final Considerations for Analysts 🤔
Mastering the art of decomposition requires practice and patience. It is a skill that develops over time as analysts encounter various types of business logic. The goal is not to create the most detailed diagram possible, but the most useful one.
Remember that the diagram is a communication tool. Its primary audience is often non-technical stakeholders who need to understand the flow of information. If the diagram is too technical, it fails its purpose. Balance the abstraction level to match the audience’s expertise.
Documentation should always support the decision-making process. When a business leader asks where a specific data point originates, the DFD should provide the answer quickly. This reliability builds trust in the analysis function. Over time, the collection of diagrams becomes a valuable asset for the organization, serving as a reference for future system changes.
As systems evolve, the diagrams must evolve with them. Stale diagrams are worse than no diagrams because they mislead. Commit to maintaining the integrity of the data flow models. Treat them with the same care as the code that will eventually be written to support them. This discipline ensures that the business logic remains transparent and accessible.
Ultimately, the value lies in the clarity gained. By breaking down the complex into the understandable, analysts empower their organizations to operate more efficiently. The structured approach of Data Flow Diagrams provides the framework for this clarity, turning chaos into order.