Designing complex distributed systems requires more than just writing code; it demands a clear visual language that stakeholders can understand. 🏗️ Data Flow Diagrams (DFDs) serve as this language, mapping how information moves across different nodes, services, and storage units. When applied to distributed environments, DFDs become critical tools for identifying bottlenecks, security risks, and consistency challenges before implementation begins.
This guide explores the methodology behind creating effective distributed system models. We will examine the core components, the decomposition process, and the specific considerations required when data traverses network boundaries. By following established modeling practices, teams can ensure their architecture supports scalability and reliability.
🌐 Understanding Distributed Systems Context
Distributed systems consist of multiple autonomous computers that appear to users as a single coherent system. Unlike monolithic architectures, these environments introduce complexity regarding communication, state management, and failure modes. 🚀 Modeling these systems requires a shift in perspective from internal process logic to external communication paths.
- Network Boundaries: Data often crosses physical or logical networks, introducing latency and potential points of failure.
- Service Granularity: Systems are broken down into smaller services, each handling specific responsibilities.
- Statelessness vs. Statefulness: Some components process requests without retaining history, while others manage persistent data.
- Asynchronous Communication: Many distributed interactions rely on message queues rather than direct synchronous calls.
Without a clear map, teams risk creating a “spaghetti architecture” where data flows are unclear. A well-structured DFD clarifies these interactions, ensuring every data point has a defined origin and destination.
🔍 The Role of Data Flow Diagrams in System Design
A Data Flow Diagram is a graphical representation of the flow of data through an information system. It does not show the timing or control logic but focuses strictly on how data enters, transforms, moves, and exits the system. 🧭
In a distributed context, the DFD helps visualize:
- Where data originates (External Entities).
- How it is processed (Processes).
- Where it is stored temporarily or permanently (Data Stores).
- How it travels between components (Data Flows).
Using DFDs allows architects to validate requirements against the proposed architecture. It ensures that no data is created or destroyed without a valid reason, maintaining integrity throughout the lifecycle.
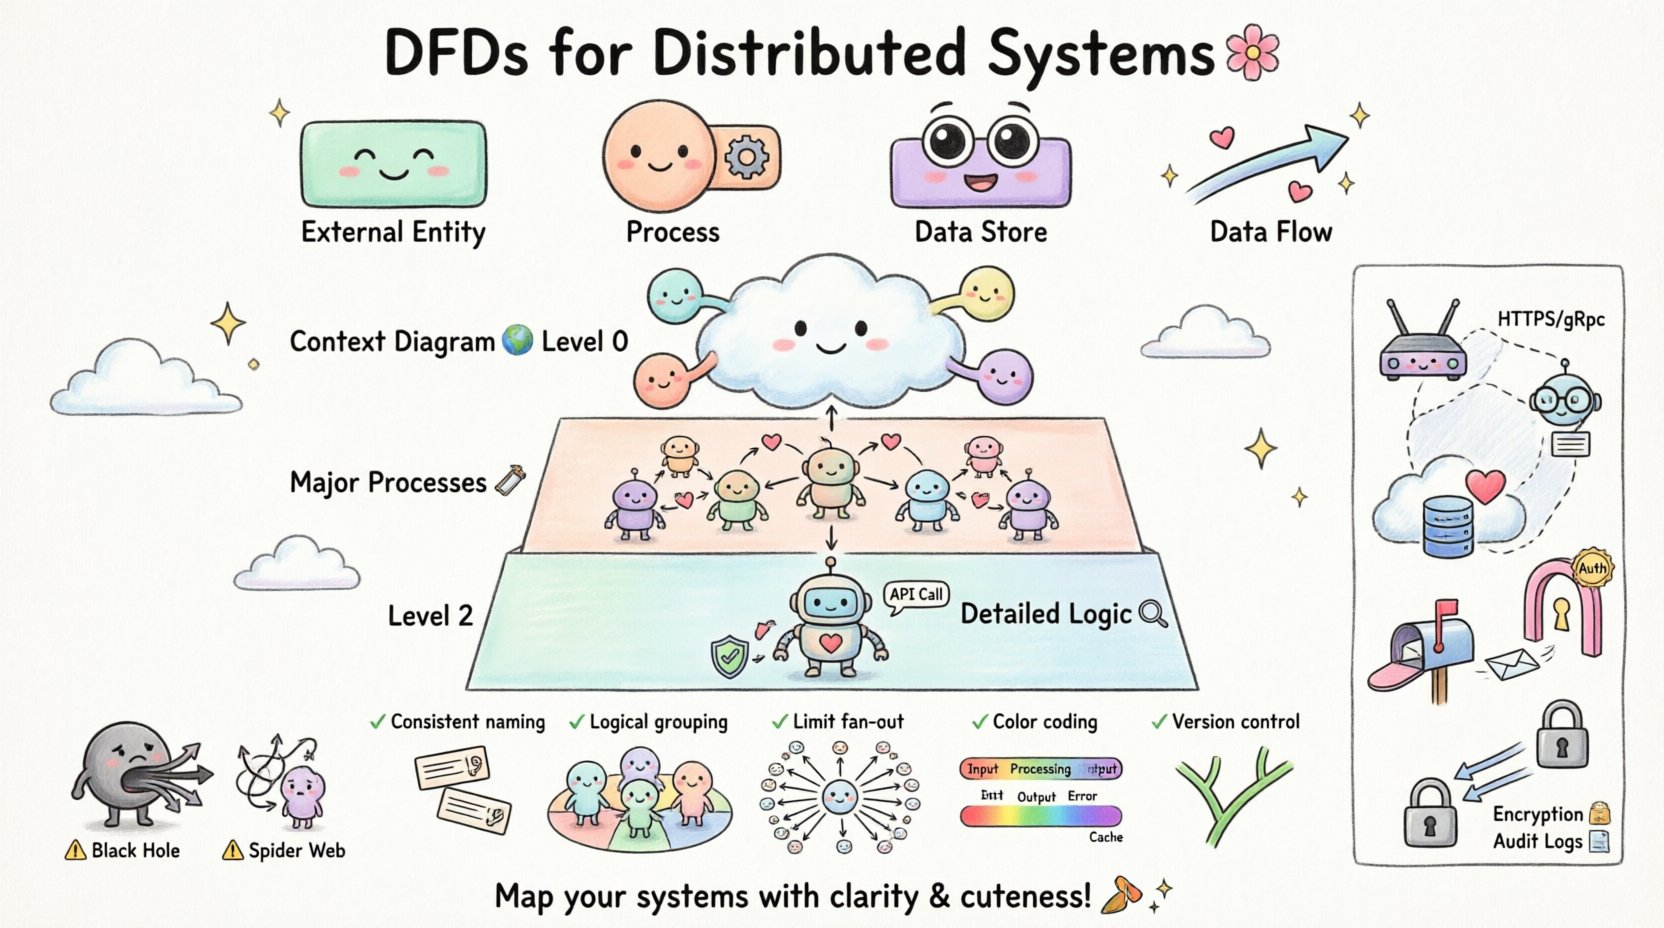
Core Components of a DFD
To build a valid model, you must understand the four primary symbols used in standard notation. Each serves a distinct purpose in the diagrammatic representation.
| Component | Function | Visual Representation |
|---|---|---|
| External Entity | Source or destination of data outside the system boundary. | Rectangle |
| Process | Transformation of data from input to output. | Circle or Rounded Rectangle |
| Data Store | Location where data is held for later use. | Open Rectangle or Parallel Lines |
| Data Flow | The movement of data between components. | Arrow |
When modeling distributed systems, it is crucial to label every arrow with a noun phrase that describes the data content, not a verb. For example, use “User Credentials” instead of “Sending Credentials”.
📉 Levels of DFD Decomposition
Complex systems cannot be represented in a single view. Decomposition allows you to drill down from a high-level overview into granular details. This approach prevents cognitive overload for the reader.
Level 0: The Context Diagram
The Context Diagram provides the highest level of abstraction. It shows the entire system as a single process and identifies all external entities interacting with it. 🌍
- Scope: Defines the boundary of the system.
- Interactions: Shows all inputs and outputs from the outside world.
- Clarity: Helps stakeholders understand the system’s purpose without technical detail.
Level 1: Major Processes
Level 1 expands the single process from the Context Diagram into major sub-processes. This level breaks the system into logical chunks based on function. 🛠️
- Decomposition: Splits the system into 5 to 9 major processes.
- Flow: Shows how data moves between these major processes.
- Stores: Introduces data stores that support these processes.
Level 2 and Beyond: Detailed Logic
Further decomposition occurs at Level 2, where specific sub-processes are broken down. This is often where implementation details begin to emerge, such as specific validation rules or API calls. 🔍
In distributed modeling, Level 2 diagrams are particularly useful for defining service boundaries. They help identify which process should reside in which service node.
⚡ Modeling Distributed Environments
Standard DFDs often assume a monolithic environment. When adapting them for distributed systems, specific notations and considerations must be applied to reflect network realities. 🌐
Here is a comparison of standard vs. distributed modeling elements:
| Element | Standard Modeling | Distributed Modeling |
|---|---|---|
| Data Flow | Direct logical flow. | Network transmission, latency, protocol. |
| Process | Single computational unit. | Microservice, Container, or Serverless Function. |
| Data Store | Local database. | Cloud Storage, Distributed Cache, or Sharded DB. |
| Boundary | System boundary. | Network boundary, Trust Zone, or API Gateway. |
When drawing data flows between processes in different nodes, it is helpful to annotate the flow with the transport mechanism (e.g., HTTPS, gRPC, Message Queue). This adds context regarding performance and security requirements.
🛡️ Handling Concurrency and State
Distributed systems frequently handle concurrent requests. A static DFD might not explicitly show timing, but it must imply how state is managed during these interactions. ⏳
- Stateless Processes: If a process does not store state, the DFD should show data flowing through and exiting without returning to a store for that specific transaction.
- Stateful Processes: If a process maintains state, there must be a clear data flow to a Data Store that persists this information.
- Consistency: Data flows representing updates must indicate how consistency is maintained across nodes.
For example, when modeling a shopping cart, the DFD should show the “Cart Data” flowing from the User Entity to a Cart Service, and then to a Database Store. If the Cart Service is distributed, the flow should indicate which node holds the authoritative copy of the data.
🚫 Common Pitfalls in Distributed Modeling
Even experienced architects can make mistakes when visualizing distributed data flows. Being aware of these common errors helps improve the quality of the model. 🚧
| Pitfall | Impact | Correction |
|---|---|---|
| Black Hole Process | Data enters a process but never leaves. | Ensure every input has a corresponding output or storage. |
| Gray Hole Process | Outputs exist, but no input explains them. | Verify all data sources for every output flow. |
| Spider Web | Too many crossing lines causing confusion. | Use sub-processes to group related flows. |
| Network Ignorance | Ignoring latency or failure points. | Annotate flows with protocol and reliability notes. |
Avoid drawing direct connections between data stores without a process in between. Data stores should only interact via processes that validate and transform the data. This prevents unauthorized direct access and ensures business logic is applied.
📝 Best Practices for Clarity
Creating a diagram that is both accurate and readable requires adherence to specific design principles. 🎨
- Consistent Naming: Use the same terminology for the same data across all diagrams. If “User ID” is used in Level 0, do not call it “Customer Key” in Level 1.
- Logical Grouping: Group related processes together visually. This helps identify service boundaries.
- Limit Fan-Out: Avoid having a single process connected to more than ten data flows. If this occurs, decompose the process.
- Color Coding: Use colors to distinguish between internal processes, external entities, and data stores. This aids quick scanning.
- Version Control: Treat diagrams as code. Store them in version control to track changes over time.
When modeling for distributed systems, consider using swimlanes to represent different trust zones or network segments. This makes it immediately obvious which components are public-facing versus internal.
🔒 Integrating Security Considerations
Security is not an afterthought; it must be modeled alongside functionality. 🔐 Data Flow Diagrams provide a unique opportunity to identify security risks early in the design phase.
- Authentication Points: Mark where user credentials are validated. This usually occurs at the boundary between an External Entity and the first Process.
- Data Encryption: Indicate where sensitive data flows are encrypted. Use labels like “Encrypted Channel” on the arrow.
- Access Control: Show which processes have permission to access specific Data Stores.
- Logging: Include flows that send audit logs to a separate logging store. This ensures traceability.
By explicitly modeling these security flows, teams can ensure that encryption and authentication are not forgotten during implementation. It forces a conversation about data privacy and compliance requirements.
🔄 Maintenance and Evolution
Systems evolve. Requirements change, and new services are added. A DFD is a living document that must be maintained to remain useful. 🔄
- Regular Reviews: Schedule periodic reviews of the DFDs with the development team to ensure they match the current codebase.
- Change Management: When a new feature is added, update the diagram immediately. Do not wait until the next documentation sprint.
- Dependency Tracking: Use the diagram to track dependencies. If a Data Store is removed, the DFD will highlight which processes will break.
Documentation that does not reflect reality creates technical debt. Keeping the DFDs current reduces onboarding time for new engineers and prevents architecture drift.
🛠️ Implementation Strategy
How do you actually start modeling a complex system? Follow a structured approach to ensure completeness. 📋
- Identify Entities: List all users, external systems, and devices interacting with the system.
- Define Boundaries: Draw the system boundary line clearly. Everything inside is the system; everything outside is external.
- Map High-Level Flows: Draw the Context Diagram first. Ensure all inputs and outputs are accounted for.
- Decompose Processes: Break down the main process into sub-processes. Label them with verbs.
- Add Data Stores: Identify where data needs to be persisted. Connect them to the relevant processes.
- Validate: Check for Black Holes and Gray Holes. Ensure every flow has a source and a destination.
- Refine: Add details about protocols, encryption, and network boundaries for distributed contexts.
This iterative process ensures that the model is robust before code is written. It saves time by catching logical errors early.
🚀 Conclusion
Data Flow Diagrams are a foundational tool for designing distributed systems. They provide the necessary clarity to understand how data moves through complex networks. By following best practices, avoiding common pitfalls, and maintaining the diagrams over time, teams can build systems that are scalable, secure, and reliable. 🌟
The effort invested in modeling pays dividends during development and maintenance. Clear diagrams facilitate better communication among developers, stakeholders, and operations teams. They serve as the single source of truth for the system’s architecture.
Start mapping your distributed systems today. Focus on clarity, consistency, and accuracy. Your future self will thank you when the architecture needs to scale or when onboarding new team members. 🏁