In the complex landscape of software engineering, clarity is currency. Architects and technical writers often face the challenge of conveying how data moves through a system without drowning stakeholders in code or configuration files. This is where the Data Flow Diagram (DFD) becomes an indispensable asset. Integrating DFDs into architecture documentation bridges the gap between abstract logic and concrete implementation, providing a visual language that developers, product managers, and auditors can all understand.
This guide explores the mechanics of embedding Data Flow Diagrams into your architectural records. It covers the foundational concepts, the integration process, maintenance strategies, and best practices to ensure your documentation remains a reliable source of truth. By following these methods, you create a living document that supports system evolution rather than becoming a static relic.
🤔 Understanding Data Flow Diagrams in System Design
A Data Flow Diagram represents the flow of information through a system. Unlike flowcharts, which emphasize control flow and decision logic, DFDs focus strictly on data movement. They illustrate where data originates, how it transforms, where it is stored, and where it eventually exits. This distinction is vital for architecture documentation because it isolates the informational backbone of the application from the procedural logic that executes it.
When you include DFDs in your architecture package, you are providing a map of the system’s cognitive load. Stakeholders can trace a piece of data from ingestion to storage and retrieval without needing to understand the underlying code logic. This abstraction is essential for high-level decision-making and compliance auditing.
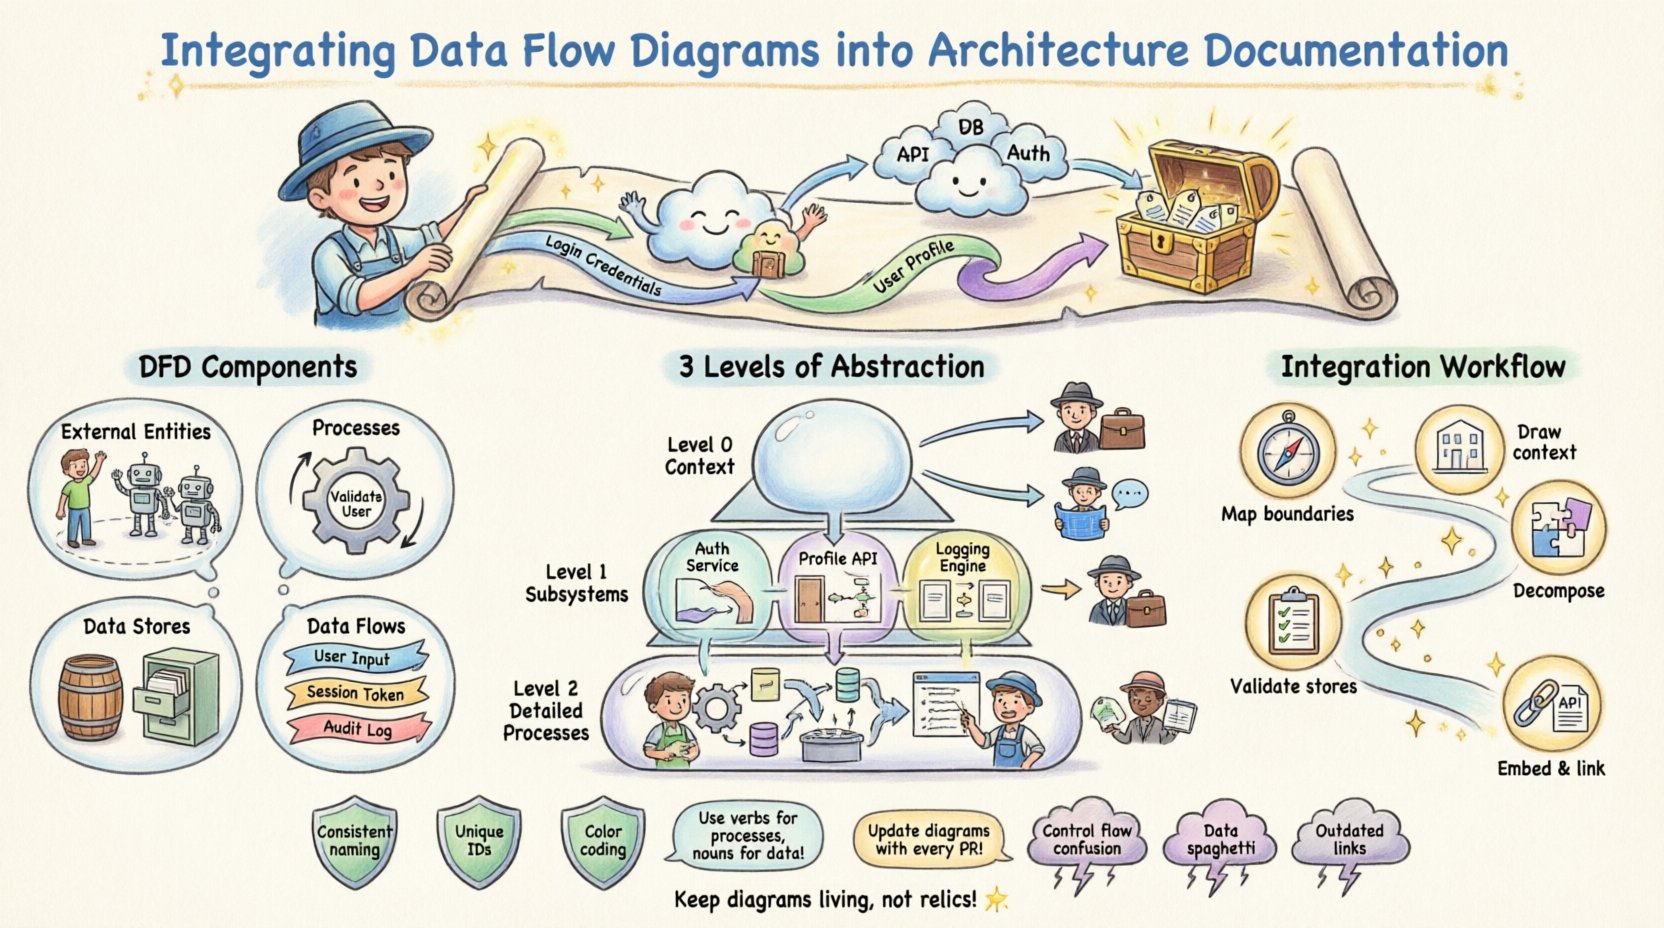
- External Entities: Represent users, systems, or organizations that interact with the system but exist outside its boundary.
- Processes: Transformations or computations performed on the data. These are not code functions but logical operations.
- Data Stores: Repositories where data rests, such as databases, file systems, or logs.
- Data Flows: The movement of data between entities, processes, and stores, typically labeled with the name of the data being transferred.
By defining these components clearly, you establish a consistent vocabulary. This reduces ambiguity when engineers discuss system behavior, ensuring that “the user profile data” refers to the same entity across the backend, frontend, and documentation.
📈 Why DFDs Are Critical for Architecture Documentation
Integrating DFDs is not merely about drawing pictures; it is about enhancing the utility of the documentation itself. A well-structured DFD adds specific value to the architecture documentation in several key areas.
🔍 Enhanced Communication
Visual models reduce the cognitive load required to understand system interactions. Textual descriptions often fail to capture the bidirectional nature of data exchanges. A diagram shows directionality instantly. When a new developer joins a project, they can look at the DFD to understand the high-level data topology before diving into the repository.
🛡️ Security and Compliance Auditing
For regulated industries, tracing data lineage is a requirement. DFDs explicitly show where sensitive data is stored and how it flows between processes. This makes it easier to identify potential security vulnerabilities, such as unencrypted data transfers or unauthorized access points to data stores.
🔄 System Onboarding
Onboarding time is reduced when visual aids are available. Instead of reading hundreds of pages of API specifications, a new team member can grasp the system’s flow within an hour. This accelerates the time-to-productivity for engineering resources.
📂 Levels of Abstraction: Context, Level 0, and Level 1
Effective architecture documentation does not rely on a single diagram. Instead, it uses a hierarchy of DFDs to provide the right level of detail for different audiences. This layered approach prevents information overload while maintaining necessary granularity.
| Diagram Level | Focus | Target Audience | Use Case |
|---|---|---|---|
| Context Diagram (Level 0) | System as a single process interacting with external entities. | Executive Stakeholders, Product Managers | High-level scope definition and boundary identification. |
| Level 1 Diagram | Major subsystems and primary data stores. | System Architects, Lead Developers | Understanding major functional blocks and data storage. |
| Level 2 Diagram | Drill-down into specific complex processes. | Backend Engineers, QA Specialists | Implementation details and specific data transformations. |
When integrating these into your documentation, ensure each level is clearly labeled. Do not mix granular details in a high-level overview. The Context Diagram should never show internal processes, only the system boundary. This discipline maintains the integrity of the abstraction.
🔄 Step-by-Step Integration Workflow
Integrating DFDs is not a one-time event. It is a workflow that runs parallel to the development lifecycle. Below is a structured approach to embedding these diagrams effectively.
1. Identify Data Boundaries
Before drawing, define the scope. What is included in the system? What is external? List all external entities (users, third-party APIs) and internal data stores. This list becomes the inventory for your diagram.
2. Map High-Level Flows
Create the Context Diagram first. Draw the system as a central circle or box. Connect all external entities to this center using arrows. Label every arrow with the specific data payload being exchanged (e.g., “Login Credentials”, “Invoice Data”, “User Profile Update”).
3. Decompose Processes
Take the central process from the Context Diagram and break it down into sub-processes. This becomes the Level 1 Diagram. Ensure that every data flow from the higher level is accounted for in the lower level. Do not introduce new external entities at this stage unless they were omitted previously.
4. Validate Data Stores
Review every data store. Is it read-only? Is it write-only? Does data persist? Document these attributes alongside the diagram in your architecture notes. This prevents assumptions about data longevity.
5. Embed and Link
Place the diagrams within the documentation repository. Use hyperlinks to connect the diagram to relevant API specifications or database schemas. If a process changes, update the diagram and the linked documentation simultaneously.
🛡️ Best Practices for Clarity and Consistency
To ensure the DFDs remain useful over time, adherence to strict notation and naming standards is required. Inconsistencies lead to confusion, which defeats the purpose of the diagram.
- Consistent Naming Conventions: Use a standard format for labels. For example, always use verbs for processes (e.g., “Validate User”) and nouns for data flows (e.g., “User Input”). Never mix verb and noun styles within the same diagram.
- Unique Process Identification: Number your processes sequentially. This helps in referencing specific transformations during code reviews (e.g., “Review Process 3.1”).
- Minimize Crossings: Try to arrange elements to minimize line crossings. If lines must cross, use a bridge notation to indicate they do not connect. This improves readability significantly.
- Logical Grouping: Group related processes together visually. If three processes handle payment, place them in a cluster. This helps the reader understand functional domains at a glance.
- Color Coding: Use subtle color variations to distinguish between different data types or security levels. For example, red borders for sensitive data flows and green for public data.
Documentation should never rely on the reader having prior knowledge. Every arrow, box, and label must be self-explanatory or linked to a glossary within the documentation.
🧹 Maintenance and Version Control Strategies
A diagram that does not match the code is worse than no diagram at all. It creates a false sense of security and misleads engineers. Therefore, maintenance is the most critical phase of DFD integration.
📝 Versioning
Include version numbers in the footer of every diagram. Tie the diagram version to the release version of the software. If a feature is deprecated, archive the old diagram rather than deleting it. This preserves the history of data flow changes for future debugging.
🔄 Change Management
Integrate DFD updates into the pull request workflow. When a developer modifies a data store or adds a new API endpoint, they must update the corresponding DFD. This ensures the documentation is part of the definition of done.
📅 Regular Audits
Schedule quarterly reviews of the architecture documentation. A designated architect should walk through the diagrams with the current codebase. If discrepancies are found, they must be logged and corrected immediately.
⚠️ Common Pitfalls and How to Avoid Them
Even experienced architects make mistakes when modeling data flows. Recognizing these pitfalls early can save weeks of refactoring and confusion.
| Pitfall | Consequence | Mitigation Strategy |
|---|---|---|
| Control Flow Confusion | Diagram implies logic where there is only data. | Ensure arrows represent data, not execution paths. Use control flow diagrams for logic. |
| Data Spaghetti | Too many lines crossing, making the diagram unreadable. | Use sub-processes to break down complexity. Group related flows. |
| Missing Data Stores | Assumption that data persists without explicit storage. | Explicitly define every data store. Do not assume in-memory buffers count as storage. |
| Outdated References | Links to processes that no longer exist. | Implement a strict review process during code merges. |
Another common error is over-decomposition. Creating a Level 2 diagram for a simple CRUD operation wastes space. Only decompose a process if it contains complex logic that requires clarification. If a process can be understood with a single line of code, keep it high-level.
🔗 Connecting DFDs with Other Architectural Artifacts
A DFD does not exist in isolation. It interacts with other documentation types to form a complete architectural picture. Integrating them creates a cohesive narrative.
- Entity Relationship Diagrams (ERD): The DFD shows how data moves; the ERD shows how data is structured. Link data stores in the DFD to their corresponding tables in the ERD.
- API Specifications: Map API endpoints to the data flows. If a flow is labeled “Submit Order,” the API spec should contain the endpoint responsible for that submission.
- Deployment Diagrams: Show which data stores are physical servers or cloud buckets. This helps infrastructure teams understand the load distribution implied by the data flow.
- Security Policies: Cross-reference sensitive data flows with encryption standards. If a flow crosses a network boundary, note the required encryption protocol.
By weaving these artifacts together, you create a web of truth. An engineer reading the DFD can click through to the API spec, then to the database schema, and finally to the deployment configuration. This reduces the friction of context switching during development.
🚀 Final Thoughts on Documentation Integrity
The goal of integrating Data Flow Diagrams is not to create a perfect picture on day one. It is to establish a standard for how data is perceived and managed throughout the project lifecycle. When the documentation evolves alongside the code, it becomes a living tool rather than a historical artifact.
Focus on consistency over perfection. A slightly simplified diagram that is always up-to-date is more valuable than a hyper-detailed diagram that is obsolete. By adhering to the workflows and standards outlined here, you ensure that your architecture documentation serves the team effectively, reducing errors and accelerating delivery.