Business processes form the backbone of any functional organization. Without a clear understanding of how data moves through systems, operations become opaque and inefficient. Data Flow Diagrams (DFD) provide a visual representation of this movement, allowing analysts to capture the current reality and design the future state. This guide explores the methodology of mapping As-Is and To-Be processes using DFDs, ensuring clarity and precision in systems analysis.
Understanding Data Flow Diagrams 🧩
A Data Flow Diagram is a structured chart that illustrates how data is processed by a system. Unlike flowcharts, which focus on control logic, DFDs focus on the movement of information. They are instrumental in the early stages of system design and business process reengineering.
Core Components of a DFD
Every valid DFD relies on four fundamental symbols. Understanding these is essential before attempting to map complex workflows.
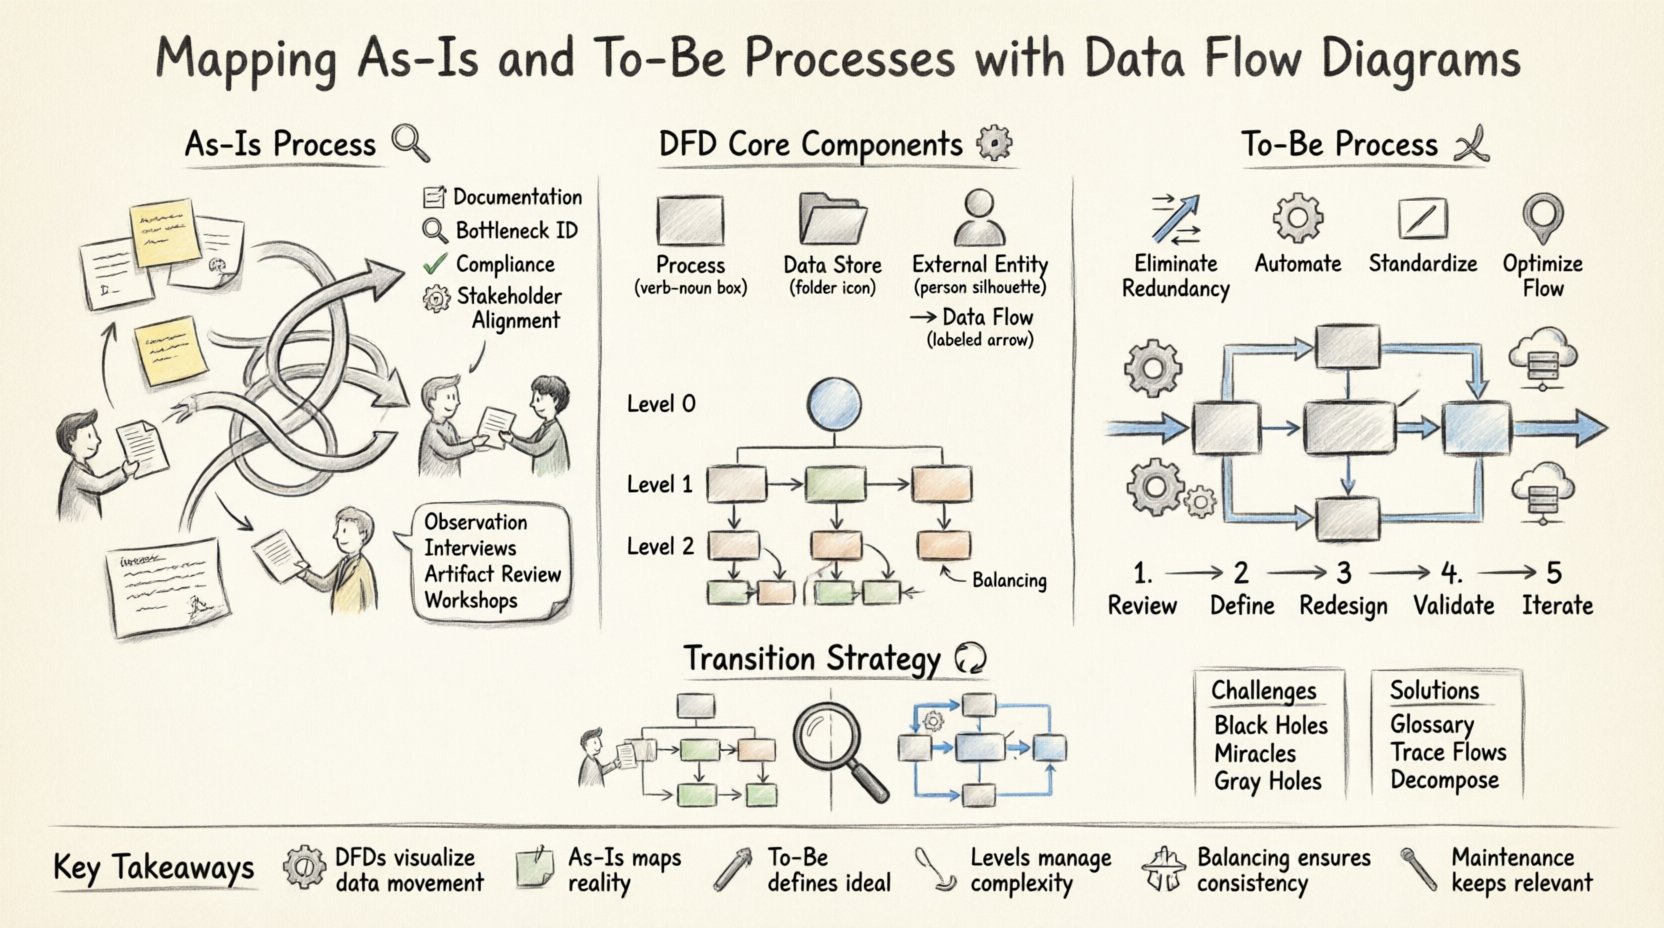
- Process (🔄): Represents an action that transforms input data into output data. This could be a calculation, a data storage operation, or a decision point.
- Data Store (📂): Indicates where data is held at rest. This includes physical databases, paper files, or even temporary memory buffers.
- External Entity (👤): Represents a source or destination of data outside the system boundary. This could be a customer, a supplier, or another department.
- Data Flow (➡️): Shows the direction of data movement between the components. Every flow must be labeled with the specific data it carries.
When constructing a diagram, ensure that every process has at least one input and one output. Data cannot be created or destroyed within a process; it can only be transformed or stored.
The As-Is Process State 🕰️
The As-Is process represents the current way work is actually performed. It captures the existing reality, including inefficiencies, workarounds, and manual interventions. Mapping this state is critical for identifying gaps before any changes are proposed.
Objectives of As-Is Mapping
- Documentation: Create a baseline record of current operations.
- Identification of Bottlenecks: Pinpoint where data slows down or gets lost.
- Compliance Verification: Ensure current practices meet regulatory requirements.
- Stakeholder Alignment: Ensure everyone agrees on how the current process functions.
Methods for Capturing As-Is Data
Accurate mapping requires gathering information from multiple sources. Relying on a single interview often leads to incomplete or biased diagrams.
- Observation: Watch users perform tasks in real-time to see actual behaviors versus reported behaviors.
- Interviews: Conduct structured conversations with process owners to understand decision logic.
- Artifact Review: Examine existing forms, reports, and logs to trace data paths.
- Workshops: Facilitate group sessions to validate the flow of information across departments.
Common Pitfalls in As-Is Mapping
| Pitfall | Consequence | Mitigation |
|---|---|---|
| Assuming the Written Procedure | Misses actual workarounds | Observe actual work |
| Over-Complexity | Diagram becomes unreadable | Use hierarchical decomposition |
| Missing Manual Steps | Underestimates effort | Include all human interactions |
| Data Naming Inconsistency | Confusion in data flow | Establish a data dictionary |
During the As-Is phase, it is common to find that the system does not align with the business needs. This misalignment is the primary driver for the subsequent To-Be design.
Designing the To-Be Process State 🚀
The To-Be process defines the ideal state of operations. It incorporates improvements, automation, and structural changes to meet strategic goals. Unlike the As-Is state, which is descriptive, the To-Be state is prescriptive.
Key Principles for To-Be Design
- Eliminate Redundancy: Remove duplicate data entry and verification steps.
- Automate Where Possible: Replace manual data transfer with system integration.
- Standardize Inputs: Ensure data enters the system in a consistent format.
- Optimize Flow: Reduce the distance data must travel between entities.
Steps to Define the To-Be State
- Review As-Is Diagram: Identify areas of high friction or error.
- Define Requirements: List specific functional and non-functional needs.
- Redesign Flows: Draw the new process without the constraints of the old system.
- Validate Feasibility: Ensure the new design is technically and operationally possible.
- Iterate: Refine the diagram based on feedback from stakeholders.
Comparing As-Is and To-Be
Visualizing the difference between the two states helps stakeholders understand the value of the proposed changes.
- As-Is: Often fragmented, reliant on manual handoffs, and prone to data silos.
- To-Be: Streamlined, integrated, and designed for data integrity.
When designing the To-Be state, avoid the temptation to automate a broken process. First, simplify the logic, then apply technology.
The Transition Strategy 🔄
Moving from As-Is to To-Be is not instantaneous. It requires a structured transition plan. The gap analysis phase bridges these two diagrams.
Gap Analysis Techniques
- Side-by-Side Comparison: Overlay the two diagrams to highlight missing data flows.
- Functional Decomposition: Break down processes to see which sub-processes are missing in the new design.
- Impact Assessment: Determine how changes affect existing data stores.
This analysis reveals the specific work required to achieve the To-Be state. It might involve training, new hardware, or software configuration.
DFD Components Deep Dive 🔍
To ensure the diagrams are accurate, each component must be defined precisely. Ambiguity in components leads to implementation errors.
External Entities
External entities define the boundary of the system. They are the users or systems that interact with the process but are not part of it.
- Labeling: Use nouns, not verbs (e.g., “Customer” not “Buying Customer”).
- Scope: Ensure entities are truly external to the scope of the project.
Processes
Processes are the engines of the diagram. They transform data.
- Verb-Noun Naming: Name processes clearly (e.g., “Validate Order”).
- Numbering: Use a numbering system to track hierarchy (e.g., 1.0, 1.1, 1.1.1).
- Single Responsibility: Each process should perform one logical function.
Data Stores
Data stores represent persistence.
- Read vs. Write: Distinguish between stores that only receive data and those that only provide it.
- Consistency: Ensure data is not stored in multiple conflicting locations.
Data Flows
Data flows connect the components.
- Directionality: Arrows must clearly indicate the direction of information.
- Labeling: Every arrow must have a unique label describing the data packet.
- No Crossing: Minimize line crossings to maintain readability.
Levels of Abstraction 📉
Complex systems cannot be represented in a single diagram. DFDs use a technique called leveling to manage complexity.
Level 0: Context Diagram
This is the highest level view. It shows the entire system as a single process and its interactions with external entities. It provides a macro view without internal detail.
Level 1: Major Processes
This diagram explodes the single process from Level 0 into major sub-processes. It shows the primary data stores and the flow between major functions.
Level 2: Detailed Processes
This level drills down into specific sub-processes from Level 1. It is used for implementation details and is often the most complex view.
Ensure that data flows entering a lower level also appear in the parent level. This consistency is called balancing.
Common Challenges & Solutions ⚠️
Creating accurate DFDs often encounters specific hurdles. Addressing these proactively saves time during the development lifecycle.
- Black Holes: A process that has inputs but no outputs. This indicates a logic error.
- Miracles: A process that produces output without any input. This is impossible in data flow.
- Gray Holes: A process that accepts data but only passes a small fraction through.
- Data Flow Conflicts: When two flows carry the same name but different meanings.
| Challenge | Solution |
|---|---|
| Conflicting Process Names | Use a central glossary for all process names |
| Missing Data Stores | Trace every data flow back to a source or destination |
| Too Many External Entities | Group entities into logical categories |
| Diagram Clutter | Use decomposition to split into lower levels |
Maintenance & Lifecycle 🛠️
A DFD is not a one-time deliverable. Processes evolve, and the diagrams must evolve with them.
Version Control
Keep track of changes to the diagram. Record the date, the author, and the reason for the change. This history is vital for auditing and future reference.
Change Management
- Trigger Identification: Determine what business change necessitates a diagram update.
- Impact Analysis: Assess how the change affects downstream processes.
- Communication: Share updated diagrams with all affected stakeholders.
Integration with Requirements
DFDs should align with the functional requirements document. If a requirement states that data must be encrypted, the diagram should reflect a security process handling that data.
Final Considerations 📝
Mapping As-Is and To-Be processes is a discipline that requires patience and precision. The goal is not just to draw pictures, but to understand the flow of information that drives the business.
- Focus on Data: Keep the focus on information movement, not control logic.
- Keep it Simple: If a diagram cannot be understood in one glance, it is too complex.
- Validate Continuously: Regularly check the diagrams against reality.
By rigorously applying these methods, organizations can achieve a clear vision of their operational landscape. This clarity enables better decision-making, reduces waste, and ensures that systems support business goals effectively.
Summary of Key Takeaways
- DFDs visualize data movement rather than control logic.
- As-Is maps document reality including inefficiencies.
- To-Be maps define the ideal state for optimization.
- Levels of abstraction manage complexity effectively.
- Balancing ensures consistency across diagram levels.
- Maintenance is required to keep diagrams relevant.
Adopting a structured approach to process mapping empowers teams to build systems that are robust, efficient, and aligned with organizational needs. The effort invested in accurate DFDs pays dividends in reduced rework and clearer communication throughout the project lifecycle.