Organizations today handle vast amounts of sensitive information. Protecting this data requires more than just firewalls and encryption. It requires a clear understanding of how information moves through systems. This is where security and compliance flow mapping with Data Flow Diagrams (DFDs) becomes essential. A well-constructed DFD provides the visual foundation necessary to identify risks, ensure regulatory adherence, and maintain system integrity.
Without visibility into data movement, security teams operate blindly. Compliance audits often fail not because of a lack of controls, but because the flow of information cannot be traced. This guide details the methodology for integrating security and compliance requirements directly into your data flow documentation. We will explore the technical aspects of mapping, the specific needs of major regulatory frameworks, and the ongoing maintenance required to keep diagrams accurate.
🔍 Understanding Data Flow Diagrams in a Security Context
A Data Flow Diagram is a graphical representation of the flow of data through an information system. In a security context, a DFD is not merely a process map; it is an inventory of data assets and their movement. It identifies where data is created, stored, processed, and destroyed.
Core Components of a Security DFD
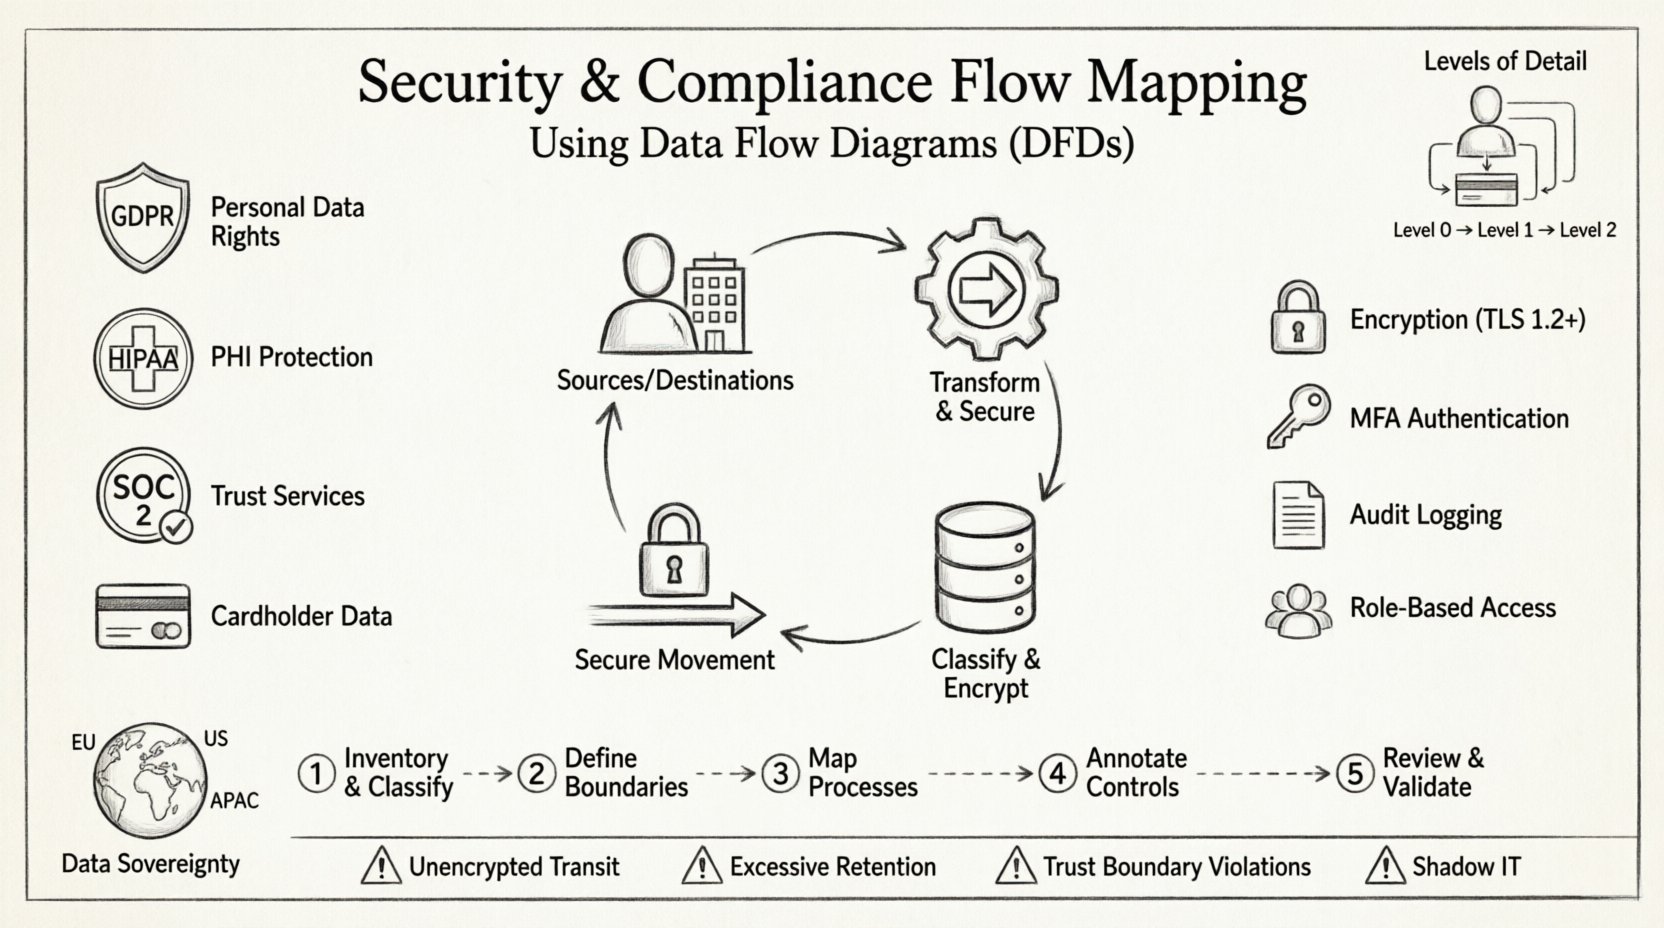
- External Entities: These represent sources or destinations of data outside the system boundaries. Examples include users, third-party vendors, or regulatory bodies. In security mapping, these are critical points for access control verification.
- Processes: These are activities that transform data. Each process must be evaluated for its ability to handle sensitive data securely. Does it encrypt data at rest? Does it log access?
- Data Stores: These represent repositories where data is held. Security mapping requires specific attention to data classification, encryption status, and retention policies within each store.
- Data Flows: Arrows showing the movement of data. This is the most critical element for compliance. Every arrow represents a potential exposure point that must be secured.
Levels of Detail in Mapping
Effective security mapping requires multiple levels of abstraction. A high-level view provides an overview, while lower levels offer the granularity needed for technical implementation.
- Context Diagram (Level 0): Shows the system as a single process and its interactions with external entities. This defines the scope of the security audit.
- Level 1 Diagram: Breaks the main process into major sub-processes. This is where major data storage points and critical external interfaces are defined.
- Level 2 Diagram: Further decomposes Level 1 processes. This level is often required for detailed risk assessments and penetration testing planning.
Using multiple levels ensures that security controls are applied at the appropriate granularity. A single diagram often cannot capture both the business logic and the technical security requirements simultaneously.
📋 Integrating Compliance Requirements into DFDs
Compliance is not an add-on; it must be woven into the fabric of the architecture documentation. Different regulations demand specific data handling practices. A robust DFD must reflect these mandates visually.
Key Regulatory Frameworks
Mapping security flows requires knowledge of specific legal and industry standards. The diagram must support the evidence required for an audit.
- GDPR (General Data Protection Regulation): Focuses on personal data. The DFD must clearly identify where personal data enters and leaves the system. It must support the “Right to be Forgotten” by showing where data is stored so it can be deleted.
- HIPAA (Health Insurance Portability and Accountability Act): Governs Protected Health Information (PHI). The diagram must show encryption of PHI in transit and at rest. It must also identify who has access to the data stores.
- SOC 2: Focuses on trust services criteria. The DFD helps demonstrate the logical architecture of security controls, such as monitoring and incident response paths.
- PCI-DSS: Governs cardholder data. The diagram must clearly delineate the Cardholder Data Environment (CDE) from the rest of the network.
Mapping Controls to Diagram Elements
To make a DFD audit-ready, security controls should be annotated directly on the diagram. This reduces the need for separate documentation that might become out of sync.
- Encryption: Mark data flows with locks or specific labels indicating TLS 1.2 or higher usage.
- Authentication: Indicate where Multi-Factor Authentication (MFA) is required for specific processes.
- Logging: Show where audit logs are generated and where they are stored.
- Access Control: Label data stores with the specific roles required to read or write data.
⚠️ Common Security Risks in Data Flows
Creating a DFD is not enough. The document must be analyzed to find vulnerabilities. Common risks often hide in the spaces between processes or in the data stores themselves.
Identifying Vulnerabilities
- Unencrypted Data in Transit: If a data flow arrow connects two systems without encryption labels, it represents a man-in-the-middle risk.
- Excessive Data Retention: Data stores that hold information longer than necessary violate compliance principles. The diagram should indicate retention periods.
- Shadow IT: Processes that exist in reality but are not on the diagram represent unmanaged risk. Regular reviews are needed to ensure the diagram matches the actual infrastructure.
- Trust Boundary Violations: When data crosses from a trusted zone to an untrusted zone without proper validation, security is compromised. The diagram must clearly mark trust boundaries.
Risk Assessment Table
The following table outlines common data flow risks and their corresponding security implications.
| Flow Characteristic | Security Risk | Compliance Impact |
|---|---|---|
| Unlabeled Data Flow | Unknown sensitivity, potential leakage | Fails audit evidence requirements |
| Data Store without Encryption | Data breach exposure | GDPR/HIPAA violation |
| Direct External Connection | Unfiltered access | SOC 2 Control Failure |
| Data Flow to Third Party | Loss of control | GDPR Article 28 Violation |
| No Logging Mechanism | Inability to detect incidents | Incident Response Failure |
🔄 Step-by-Step Flow Mapping Process
Building a security-compliant DFD is a systematic process. It requires collaboration between architects, security engineers, and compliance officers. The following steps outline the workflow.
Step 1: Inventory and Classification
Before drawing any lines, you must know what data exists. Create a comprehensive inventory of all data assets.
- Identify all data types (PII, PHI, Financial, Intellectual Property).
- Assign sensitivity labels to each data type.
- Document the legal basis for processing this data.
- Map data types to specific databases or file systems.
Step 2: Define System Boundaries
Draw the perimeter of the system. Everything outside this line is external. This boundary defines the scope of the security assessment.
- Mark the network perimeter clearly.
- Identify all external interfaces (APIs, Web Ports, Sockets).
- Define the trust zones within the system (e.g., DMZ, Internal, Restricted).
Step 3: Map the Processes
Document the logical steps that data undergoes. Focus on the transformation of data rather than the code implementation.
- Start with the external entity requesting data.
- Draw the path through the application.
- Identify every database interaction.
- Note any external API calls made by the system.
Step 4: Annotate Security Controls
Add the security layer to the map. This transforms a standard flow diagram into a security asset.
- Label flows with encryption protocols.
- Annotate data stores with access controls.
- Mark audit points where logs are generated.
- Indicate data retention periods on storage nodes.
Step 5: Review and Validate
A diagram is only as good as its accuracy. Validation ensures that the map matches reality.
- Conduct walkthroughs with developers.
- Verify the diagram against the live environment.
- Check for discrepancies between the map and the actual code.
- Update the diagram immediately after any infrastructure change.
🏛️ Specific Considerations for Data Sovereignty
Modern compliance often includes data sovereignty requirements. This means data must reside in specific geographic locations. A DFD must reflect this constraint.
- Geographic Tagging: Label data stores with their physical location or cloud region.
- Replication Paths: Show where data is copied. If data moves from Europe to the US, this requires specific legal justification.
- Processing Locations: Note where computation happens. Even if data stays in the EU, processing in a different region can trigger compliance issues.
Ignoring these nuances can lead to severe penalties. The diagram serves as the visual proof that data residency policies are respected.
📝 Maintenance and Version Control
A security DFD is a living document. Systems change, features are added, and infrastructure is refactored. If the diagram is not updated, it becomes a liability rather than an asset.
Change Management Integration
Diagram updates should be part of the software development lifecycle (SDLC). No feature should be deployed without a corresponding update to the flow map.
- Link diagram versions to code commits.
- Require diagram review during code reviews.
- Automate checks where possible to detect unauthorized flows.
- Establish a schedule for full diagram re-validation (e.g., quarterly).
Auditing the Diagram
Regular audits ensure the document remains useful. This involves checking the diagram against the current state of the infrastructure.
- Verify that all active endpoints are on the map.
- Ensure deprecated processes are removed.
- Check that security labels are current.
- Validate that trust boundaries have not shifted.
🛠️ Technical Implementation Details
When documenting flows, specific technical details add value. This helps engineers implement controls correctly.
Data Classification
Not all data is treated equally. The DFD should visually distinguish between data types.
- Public: No special controls required.
- Internal: Access restricted to employees.
- Confidential: Encryption and strict access logging required.
- Restricted: Highest level of protection, often requiring separate storage.
Trust Boundaries
Every time data crosses a boundary, it is at risk. The diagram must clearly mark these lines.
- Network Boundary: Firewall rules apply here.
- Application Boundary: Input validation and authentication apply here.
- Database Boundary: Access control lists and encryption apply here.
- Organizational Boundary: Contracts and data processing agreements apply here.
📊 The Value of Visual Documentation
Text-based documentation is often difficult to read and maintain. Visual diagrams offer immediate clarity. They allow stakeholders to understand complex systems quickly.
- Communication: A diagram bridges the gap between technical teams and management.
- Training: New employees can learn the system architecture faster with a map.
- Incident Response: During a breach, responders need to know where data flows to isolate the issue.
- Optimization: Identifying unnecessary data flows can improve performance and reduce cost.
Investing time in creating accurate flow maps pays dividends in security posture and compliance readiness. It shifts the focus from reactive fixes to proactive design.
🔐 Best Practices for Security Architects
To ensure the DFD remains a reliable tool, follow these best practices.
- Keep it Simple: Avoid clutter. If a diagram is too complex, split it into multiple views.
- Use Standard Symbols: Ensure everyone understands the notation used.
- Update Frequently: Treat the diagram as code.
- Secure the Diagram: The DFD itself contains sensitive information. Protect the file from unauthorized access.
- Integrate with Security Tools: Where possible, link diagram elements to vulnerability scanners or configuration management databases.
By adhering to these guidelines, security teams can create a robust framework for managing risk. The diagram becomes the single source of truth for data security.
🚀 Moving Forward
Security and compliance are continuous journeys. They require constant vigilance and adaptation. Data Flow Diagrams provide the necessary structure to navigate this complexity. By mapping every byte of data movement, organizations gain the visibility needed to protect their assets.
Start by auditing your current documentation. Identify gaps in your flow maps. Engage your security team to annotate existing diagrams with control information. Over time, these diagrams will become the backbone of your security architecture.
Remember, a map is only useful if it is accurate. Dedicate resources to maintaining these documents. The cost of maintaining a DFD is far lower than the cost of a compliance failure or a data breach. Visibility is the first step toward security.