Effective communication between business stakeholders and technical teams often hinges on shared understanding. When requirements are ambiguous, projects drift, and timelines extend. Data Flow Diagrams (DFDs) offer a robust visual language to bridge this gap. By incorporating DFDs into stakeholder workshops, facilitators can translate complex business logic into clear, actionable visual models. This guide explores the methodology of facilitating workshops using DFDs to ensure accurate requirements gathering and process alignment.
🎯 Why Use Data Flow Diagrams in Workshops?
Business stakeholders often struggle to articulate needs in technical terms. Conversely, technical teams may over-index on implementation details before understanding the business context. DFDs sit comfortably between these two groups. They focus on the movement of data rather than the physical hardware or software architecture. This abstraction allows participants to concentrate on the “what” and “why” of the system.
Using DFDs during a workshop provides several distinct advantages:
- Visual Clarity: Complex workflows become easier to digest when represented as shapes and arrows.
- Common Language: DFD symbols (processes, data stores, entities) create a standardized vocabulary.
- Gap Identification: Missing data flows or undefined processes become immediately visible when drawn out.
- Reduced Ambiguity: Textual descriptions often allow for multiple interpretations. A diagram enforces a specific logic flow.
- Active Engagement: Workshops where participants draw or correct diagrams foster deeper ownership of the requirements.
📋 Pre-Workshop Preparation
Success in a stakeholder workshop does not begin when the meeting starts. It begins with rigorous preparation. The facilitator must set the stage to ensure the session remains focused and productive.
1. Define the Scope and Objectives
Before inviting participants, clarify the boundaries of the workshop. Are you modeling the entire enterprise system, or just a specific module? A clear scope prevents scope creep during the session. Define the primary objective, such as validating the current state (As-Is) or designing the future state (To-Be).
2. Select the Right Participants
Identify stakeholders who possess the necessary knowledge. Include:
- Process Owners: Individuals responsible for the business function being modeled.
- End Users: People who actually perform the tasks in the system.
- Subject Matter Experts: Those with deep domain knowledge.
- Technical Representatives: Architects or developers who can assess feasibility.
3. Prepare the Materials
You do not need expensive software to create diagrams. Physical whiteboards, sticky notes, and markers are often superior for collaborative sessions. If digital tools are preferred, ensure the environment is set up for real-time editing. Prepare a legend explaining the symbols you will use:
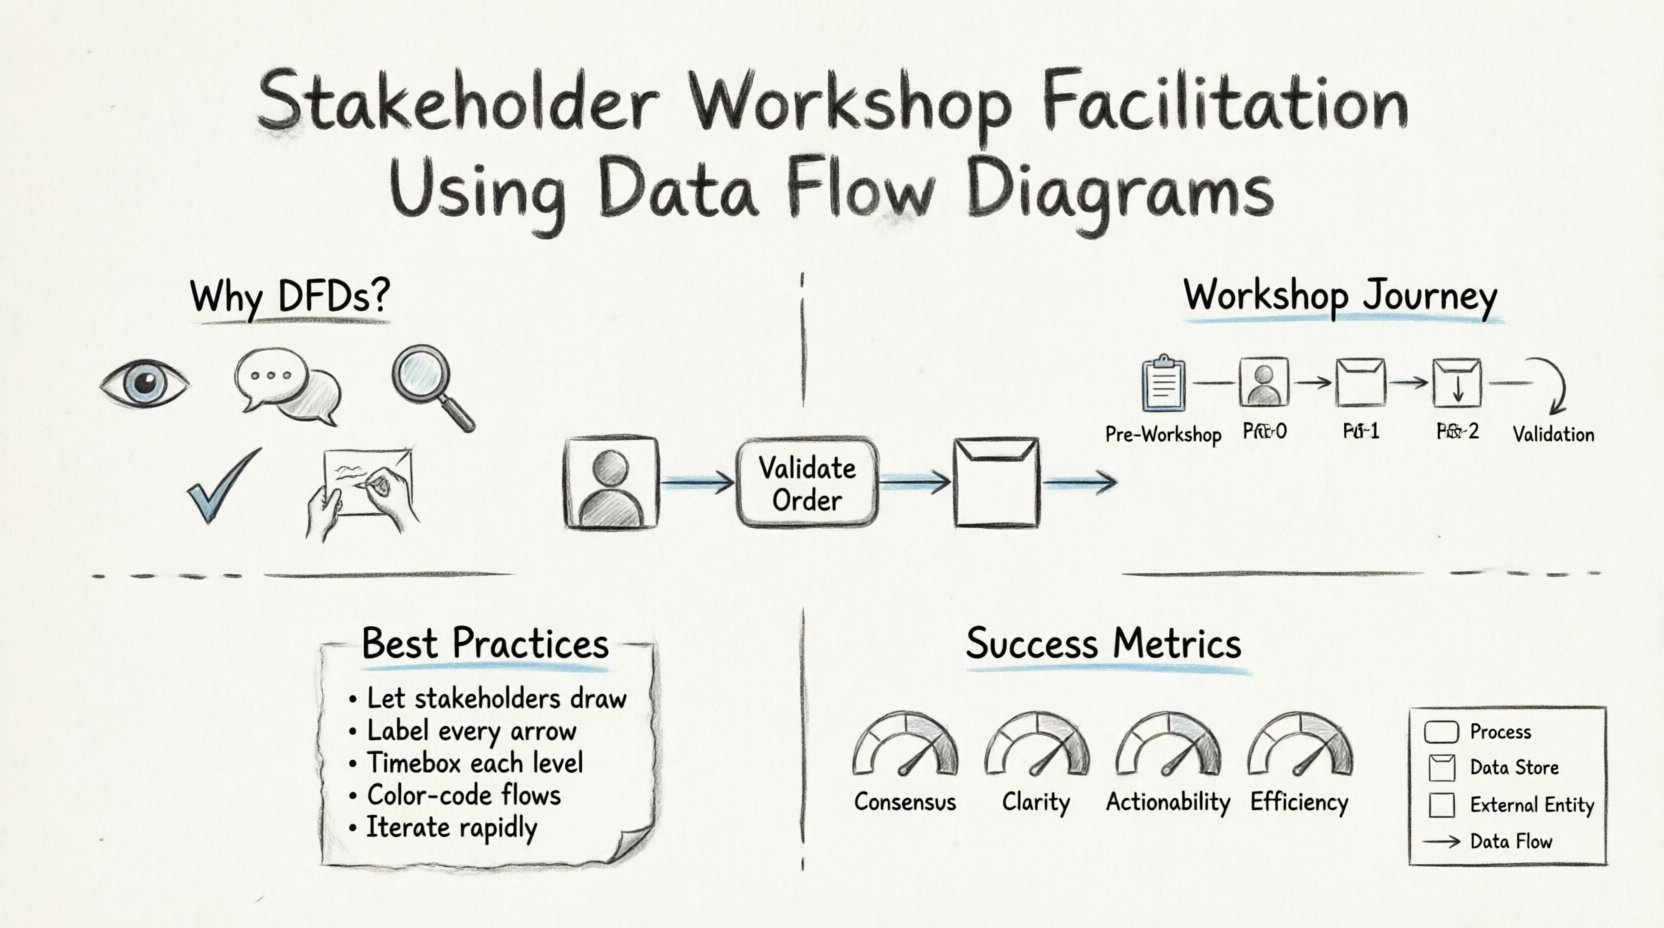
- Process: A rounded rectangle or circle representing an action or transformation.
- Data Store: An open-ended rectangle representing a place where data is held.
- External Entity: A square or circle representing a person, system, or organization outside the boundary.
- Data Flow: An arrow showing the direction of data movement.
🚀 Conducting the Session: Step-by-Step
The facilitation process should follow a logical progression from high-level abstraction to detailed specifics. This prevents stakeholders from becoming overwhelmed by complexity too early.
Step 1: The Context Diagram (Level 0)
Begin with the highest level of abstraction. Draw a single process representing the entire system. Surround this with external entities that interact with the system. Identify the major data flows entering and leaving the system.
Facilitator Tip: Ask stakeholders to define the boundaries. What is inside the system? What is outside? This discussion often reveals hidden dependencies or regulatory constraints.
Step 2: Decomposition (Level 1)
Once the context is agreed upon, break down the main process into major sub-processes. These should represent the core functions of the system. For example, a “Process Order” system might decompose into “Receive Order,” “Check Credit,” and “Ship Goods.” Ensure every data flow from the context diagram connects to at least one sub-process.
Step 3: Detailed Flows (Level 2)
Drill down further only if necessary. If a Level 1 process is too complex, decompose it again. Be cautious here. Over-detailing can bog down the workshop. Only add detail if the business logic is unclear or if the technical team requires it for design.
Step 4: Validation and Review
Throughout the session, continuously validate the diagram. Ask questions like:
- Is all data coming from a source or a store?
- Does every process have at least one input and one output?
- Are the data flows labeled clearly?
⚖️ Handling Conflict and Ambiguity
Workshops often reveal disagreements regarding how business processes actually function. One stakeholder may claim a step is manual, while another insists it is automated. These conflicts must be managed constructively.
1. Focus on Data, Not Implementation
When stakeholders argue about *how* a task is done, steer the conversation back to *what* data moves. Does the data exist? Is it valid? Is it needed? This keeps the DFD focused on the information flow rather than the procedural details.
2. Use Decision Points
If a process involves branching logic (e.g., “If credit approved, then ship; otherwise, flag”), represent this in the data flow. Do not try to draw every decision branch in the initial diagram. Mark the condition on the arrow or note it as a requirement for the specific process.
3. Document Assumptions
If the group cannot agree on a specific flow, record it as an assumption. Do not let one unresolved point stall the entire workshop. Note the assumption and assign an owner to research it before the next session.
🛠️ Common Challenges and Solutions
Facilitators often encounter specific hurdles when working with DFDs. Recognizing these early allows for proactive mitigation.
| Challenge | Impact | Mitigation Strategy |
|---|---|---|
| Stakeholders confuse Data Stores with Processes | Incorrect modeling of storage vs. action | Reinforce the definition: Processes transform data; Stores hold data. |
| Arrows cross over each other excessively | Diagram becomes hard to read | Allow the diagram to grow physically. Use off-page connectors if necessary. |
| Too much technical jargon used | Business stakeholders disengage | Translate technical terms into plain language on the diagram labels. |
| Scope creep during modeling | Session runs over time, incomplete model | Strictly enforce the defined scope. Move out-of-scope items to a “parking lot” list. |
| Missing data flows | System design will fail to meet needs | Apply the “Conservation of Data” rule: Every input must result in an output or storage. |
🔎 Best Practices for Facilitation
To maximize the effectiveness of the workshop, adhere to these core principles. They ensure the session remains collaborative and focused on the output.
- Encourage Participation: Do not draw the diagram yourself. Let the stakeholders guide the drawing. You are the facilitator, not the artist. This ensures they understand the logic they are creating.
- Iterate Rapidly: Don’t aim for perfection in the first draft. Get a rough model down, then refine. It is easier to move arrows on a whiteboard than to start over.
- Label Everything: Every arrow must have a noun phrase label (e.g., “Customer Data,” “Invoice,” “Report”). Every process must have a verb-noun label (e.g., “Calculate Tax”).
- Respect Timeboxes: Allocate specific time for each level of decomposition. If the Level 1 diagram is taking too long, move to a follow-up session rather than rushing.
- Use Color Coding: If using digital tools or colored markers, use colors to distinguish between different types of data flows (e.g., financial data vs. operational data).
📝 Post-Workshop Validation
The workshop ends with a diagram, but the work is not done. The model must be validated against reality to ensure it accurately reflects the business needs.
1. Distribution and Feedback
Distribute the finalized diagrams to all participants. Ask them to review them in isolation. Often, when stakeholders look at the diagram later, they spot missing flows or incorrect connections that they missed during the heat of the workshop.
2. Walkthroughs
Schedule brief walkthrough sessions with key process owners. Walk through a specific transaction from start to finish using the diagram. Verify that every step in their daily work is represented.
3. Version Control
Label the diagrams with a version number and date. As requirements evolve, the DFD must evolve. Maintain a clear history of changes to understand how the system definition has shifted over time.
🧠 The Psychology of Visual Modeling
Understanding the human element is as important as understanding the technical symbols. Visual modeling changes how the brain processes information. It offloads cognitive strain from working memory to the external environment.
When stakeholders see the data flow, they can identify logical gaps that text descriptions hide. For instance, a process that requires data but has no input arrow is an immediate logical error. This visual truth is powerful. It allows non-technical users to challenge technical assumptions without needing to know code.
Furthermore, the act of drawing creates cognitive commitment. When a stakeholder draws a box, they are mentally committing to that process existing. This reduces the likelihood of them rejecting the requirement later in the design phase.
📊 Measuring Workshop Success
How do you know the workshop was successful? It is not just about the diagram itself. Look for these indicators:
- Consensus: Do stakeholders agree on the boundaries and flows?
- Clarity: Can a new team member understand the process by looking at the diagram alone?
- Actionability: Are the requirements derived from the diagram clear enough for technical design?
- Efficiency: Was the session completed within the allotted time without significant overtime?
🔄 Continuous Improvement
DFDs are not static artifacts. They are living documents that evolve with the business. As new regulations are introduced or market conditions change, the data flows will shift. The facilitation technique used in the workshop should be repeatable. Document the process, the templates used, and the lessons learned. This creates a standard operating procedure for future requirements gathering efforts.
🔗 Integrating with Other Models
While DFDs are powerful, they are rarely used in isolation. They work best when integrated with other modeling techniques. For example:
- Entity-Relationship Diagrams (ERD): Complement DFDs by defining the structure of the data stores.
- Use Case Diagrams: Complement DFDs by focusing on user interactions rather than data movement.
- Flowcharts: Complement DFDs by detailing the logic within a single process.
During the workshop, clarify which model serves which purpose. If the goal is to understand data storage, switch to an ERD. If the goal is to understand user actions, switch to a Use Case. Keeping these distinctions clear prevents confusion and ensures the DFD remains focused on its primary strength: the movement of information.
💡 Summary of Facilitation Techniques
Successful facilitation relies on a blend of preparation, active listening, and technical knowledge. The goal is not to create a perfect diagram in one sitting, but to create a shared understanding of the system’s data flow.
Key takeaways for facilitators include:
- Start with the Context Diagram to establish boundaries.
- Decompose processes logically, not technically.
- Ensure every data flow is labeled and has a source and destination.
- Manage conflicts by focusing on data, not implementation details.
- Validate the model with stakeholders after the session.
By mastering the art of DFD facilitation, organizations can reduce miscommunication, align technical delivery with business needs, and build systems that truly support their operational goals. The visual clarity provided by these diagrams serves as a foundation for all subsequent development and analysis phases.