Introduction
Project planning—especially for complex, multi-phase initiatives like international conferences, software launches, or large-scale infrastructure rollouts—often hinges on accurately modeling task dependencies and timelines. Traditionally, this process has been labor-intensive, requiring manual construction of network diagrams, tedious calculations of critical paths, and repeated iterations to refine timelines.
Enter modern AI-driven visual modeling tools like Visual Paradigm’s AI PERT Chart Generator. This advanced system eliminates the need for hours of manual diagramming by converting natural language inputs into fully editable, industry-compliant PERT charts in seconds. It is not just a time-saver—it is a strategic enabler of precision, agility, and risk-aware scheduling in dynamic environments.
Guidelines: A Step-by-Step Workflow for AI-Powered PERT Chart Generation
- Define the Project Scope in Natural Language
Begin with a clear, high-level description of your project. For example: “We are organizing a global tech conference over six months, including marketing, venue booking, speaker coordination, and event execution.” Focus on sequencing, dependencies, and key milestones. Avoid overly technical jargon—simple, conversational language works best.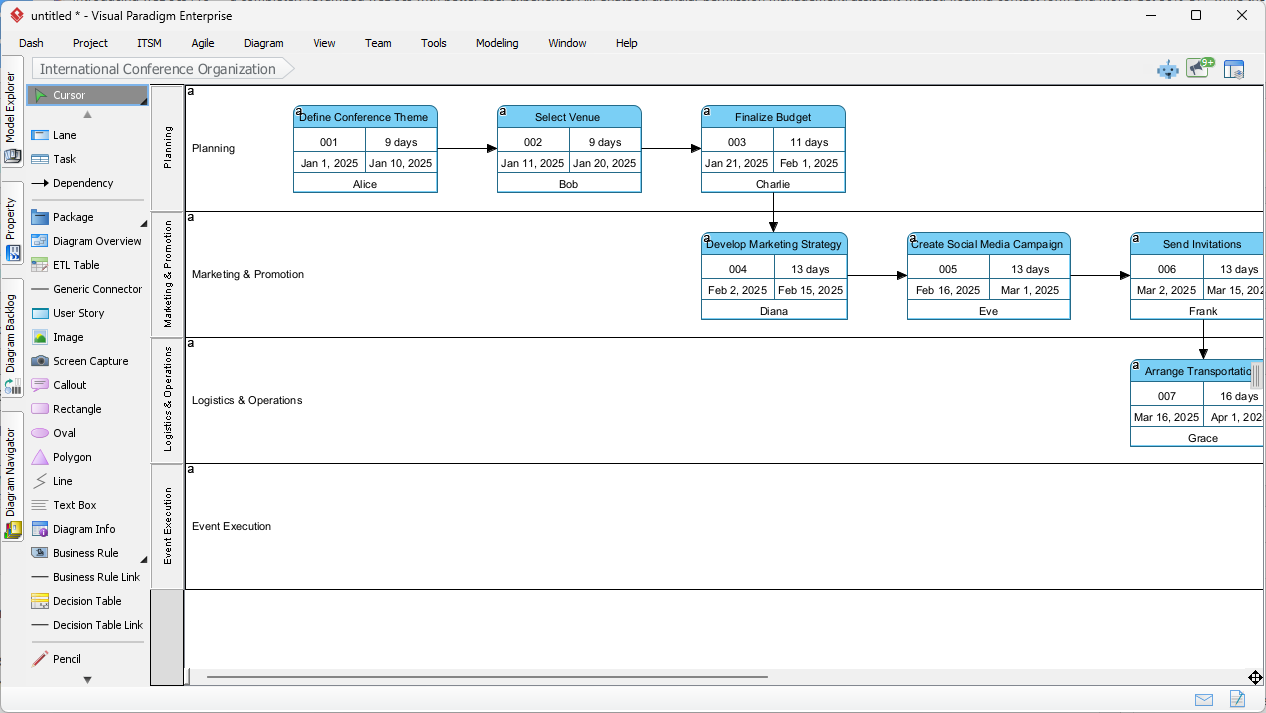
- Choose Your Tool: Desktop or Chatbot Interface
– For enterprise-grade projects with complex dependencies, use the Visual Paradigm Desktop application. It offers full control over diagram structure, swimlanes, resource allocation, and export formats.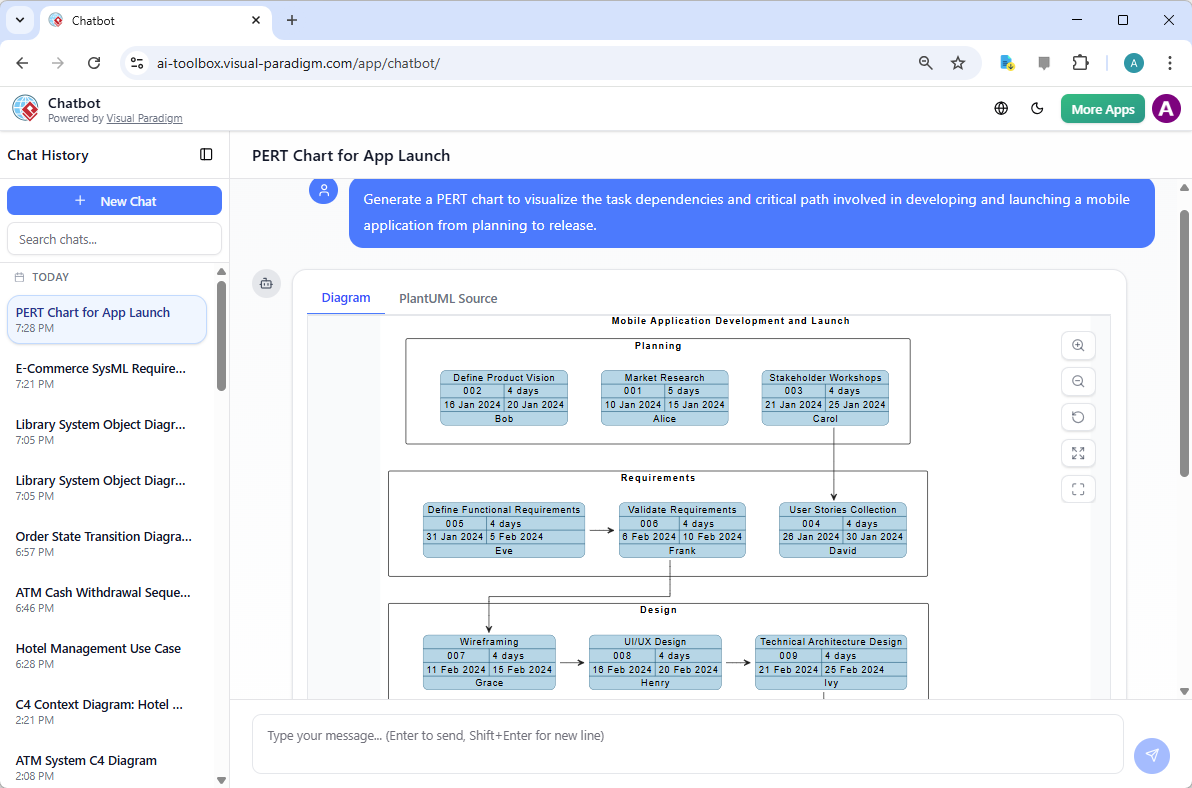 – For quick brainstorming or team meetings, use the Visual Paradigm AI Chatbot in the browser. Simply type: “Generate a PERT chart for a mobile app launch with dependencies” and receive a ready-to-use diagram.
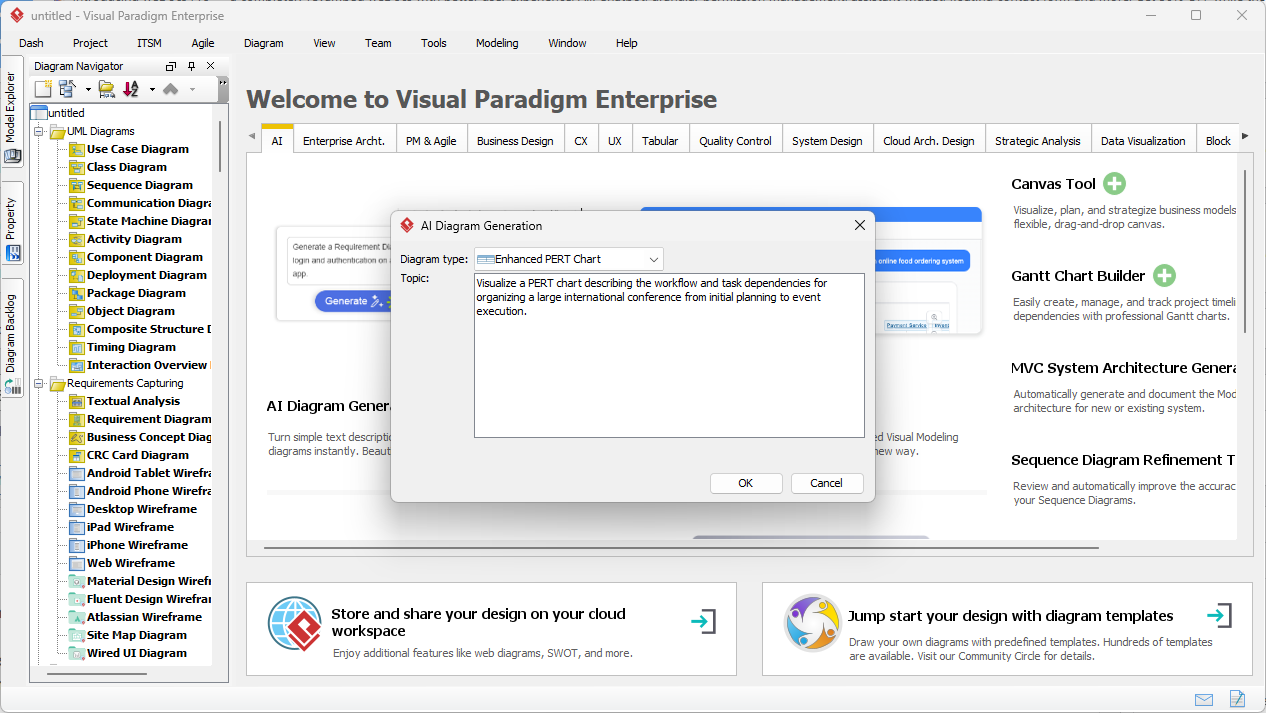
 - InitiateAI Diagram Generation
In either interface, click the AI Diagram Generation button. The system analyzes your input, identifies key tasks, and maps logical sequences based on dependency rules (e.g., “Marketing starts after market research ends”). - Review the Generated PERT Chart
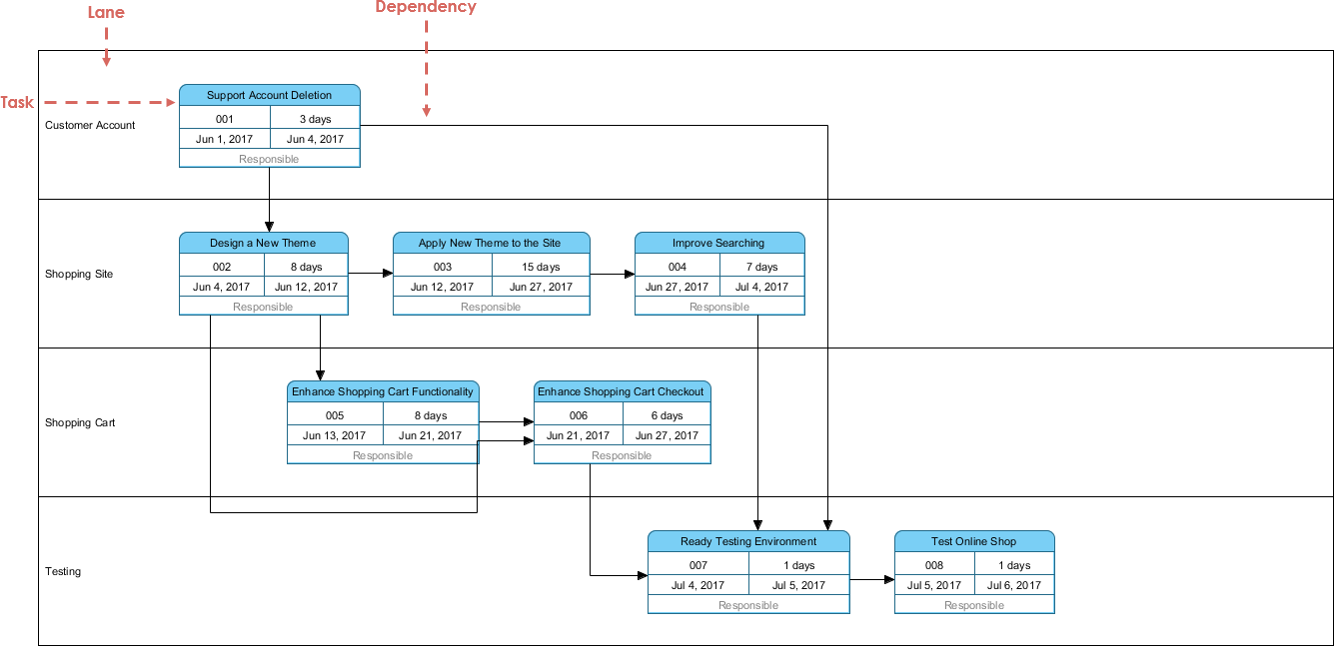
The AI outputs a structured, color-coded network diagram with:- Event nodes (circles or rectangles)
- Activity arrows indicating task flow
- Task IDs, durations, assigned personnel, and swimlanes (Planning, Marketing, Logistics, etc.)
- Automatically calculated critical path and slack (float) values
At this stage, the AI has completed 80% of the structural and mathematical work—including forward and backward passes, early/late times, and path duration analysis.
- Refine the Model with Human Expertise
This is where your domain knowledge takes over. Adjust:- Task durations (e.g., increase market research by 10 days)
- Dependencies (e.g., change “Marketing starts after Research” to “Marketing starts after Stakeholder Feedback”)
- Lags or buffers between activities (e.g., add a 3-day buffer for travel logistics)
- Three-point estimates (optimistic, most likely, pessimistic) for risk-aware planning
These refinements ensure the model reflects real-world constraints and uncertainty.
- Validate and Export
Ensure the critical path is correctly highlighted. Verify that changes in task durations impact the overall timeline as expected. Export the final PERT chart in formats such as PDF, PNG, or as a reusable model file (e.g., .vpm) for sharing with stakeholders or integration into project management systems like Jira or Microsoft Project.
Key Concepts: Understanding the Foundation of PERT and AI Modeling
Before diving into automation, it’s essential to understand the core principles that make PERT charting a powerful project management tool:
What is a PERT Chart?
A PERT (Program Evaluation Review Technique) chart is a network diagram that visualizes the sequence of tasks in a project, showing dependencies and durations. It helps identify which tasks are on the critical path—those that directly determine the project’s completion date. Unlike Gantt charts, PERT charts focus on relationships and logic rather than time-based bars.
Event Nodes vs. Activity Arrows
In PERT modeling:
- Event Nodes represent milestones (e.g., “Research Complete”) and are typically circles or rectangles.
- Activity Arrows represent tasks with duration (e.g., “Marketing Campaign”) and are connected between events.
Three-Point Estimation and Expected Duration
PERT uses a probabilistic approach to task duration. Instead of assuming a single time estimate, it uses three:
- Optimistic (O): Best-case scenario (e.g., 3 weeks)
- Most Likely (M): Realistic estimate (e.g., 5 weeks)
- Pessimistic (P): Worst-case scenario (e.g., 8 weeks)
The Expected Duration (TE) is calculated as:
TE = (O + 4×M + P) / 6
This formula provides a weighted average that accounts for uncertainty and is widely used in PMP and project governance standards.
Slack (Float) and the Critical Path
Slack indicates how much a task can be delayed without affecting the project end date. Tasks with zero slack are on the critical path—any delay in these tasks will directly prolong the project.
The AI in Visual Paradigm automatically computes slack and highlights the critical path in red or bold to help project managers prioritize risk mitigation.
Tips and Tricks: Quick Wins for Real-World Project Planning
Here are practical, time-tested tips to enhance your use of AI PERT charting:
- Use Scenario Prompts for Risk Testing
Instead of one fixed scenario, create two versions: one with optimistic times, one with pessimistic. This allows you to compare total project duration and identify hidden bottlenecks under stress. - Break Projects into Phases First
Structure your input as phases (e.g., Planning → Design → Development → Launch). This improves AI parsing and makes output more intuitive and readable. - Reference Real-World Timelines
Include realistic durations: e.g., “Marketing campaign: 6 weeks” instead of “3 weeks”—even if the AI suggests shorter times, this prevents over-optimism. - Test with Your Team
Have a colleague input the same project description and compare outputs. Differences in dependency interpretation can reveal blind spots. - Use the AI to Generate Gantt Views
Once the PERT chart is refined, export it to a Gantt view to overlay task durations and resource allocation. This bridges the gap between logical flow and scheduling.
Real-World Application Examples
Example 1: International Conference Planning
- Input: “Plan a 6-month international conference with speaker booking, venue selection, registration, and travel logistics.”
- Output: AI creates swimlanes for Planning, Logistics, Marketing, and Operations.
- Identifies critical path: Speaker booking → Venue booking → Registration → Event Day.
- Highlights 3-day slack in travel planning, allowing for flexibility.
Example 2: Mobile App Launch
- Input: “Launch a mobile app with market research, UI design, development, QA, and marketing campaign.”
- AI infers dependencies: Market research → UX → Development → QA → Marketing.
- Calculates expected durations using three-point estimates, resulting in a realistic 12-week timeline.
Why AI-Powered PERT Charts Outperform Manual Methods
Traditional PERT charting involves:
- Manual node placement and arrow drawing
- Time-consuming forward and backward pass calculations
- High risk of human error in dependency logic
- Difficulty scaling to large or dynamic projects
AI-powered tools eliminate these issues by:
- Automating dependency inference from natural language
- Performing real-time path calculations and slack analysis
- Providing an interactive, editable model that evolves with your input
- Ensuring output adheres to ISO or PMI standards
Conclusion: The Future of Project Scheduling
AI is not replacing project managers—it is empowering them. By automating routine, high-volume tasks like PERT chart generation, professionals can shift focus from execution to strategy: identifying risks, testing scenarios, optimizing resource allocation, and communicating timelines with confidence.
With tools like Visual Paradigm’s AI PERT Chart Generator, project planning becomes:
- Agile—quickly iterate on scenarios
- Accurate—based on probabilistic, real-world estimates
- Transparent—critical path clearly visible
- Accessible—even non-technical team leads can generate and understand project timelines
Whether you’re planning a global conference or launching a new AI product, the integration of AI into visual modeling represents the next evolution of project management—where clarity, speed, and precision meet at the intersection of language and logic.
Get Started Today
Begin your journey with AI-powered project modeling by:
- Download the Visual Paradigm Desktop Edition to access full AI diagram generation, swimlane support, and advanced scheduling features.
- Explore the AI Chatbot in your browser to generate quick PERT charts during meetings or brainstorming sessions.
- Use built-in templates for common projects like product launches, event planning, or software development.
Visit the official website to learn more: https://www.visual-paradigm.com
Articles and resources related to Visual Paradigm’s AI capabilities and PERT Chart tools for project management:
-
Pert Chart Tool – Visual Paradigm Online: A powerful online tool designed to help project managers visualize task dependencies, estimate timelines, and manage project schedules effectively.
-
Complete PERT Chart Tutorial – Visual Paradigm: A step-by-step tutorial guiding users through creating and using PERT charts in the cloud to plan and manage complex projects efficiently.
-
Pert Chart User Guide – Visual Paradigm: Detailed documentation covering how to create, edit, and utilize PERT charts within the desktop software for robust project management.
-
Free PERT Chart Templates – Visual Paradigm: Access a collection of professionally designed templates to kickstart project planning with minimal setup.
-
Pert Chart Tutorial – Visual Paradigm Knowledge Base: An in-depth resource explaining the purpose, construction, and application of PERT charts in real-world project management scenarios.
-
Enhanced PERT Chart Features – Visual Paradigm: Explore advanced capabilities such as dynamic scheduling, critical path analysis, and seamless integration with project timelines.
-
Project Management Guide – Visual Paradigm User Guide: A comprehensive guide to the platform’s project management suite, including PERT charts, Gantt charts, and resource allocation tools.
-
Pert Chart for Project Management – Cybermedian: This article provides practical insights and real-world online examples for using PERT charts to improve project planning.
-
Integrating PERT Charts with RACI Roles in Task Management: A practical guide on combining PERT charts with RACI roles to enhance timeline accuracy and accountability in management workflows.
-
Visual Paradigm AI Suite: A Comprehensive Guide: This overview details how the platform’s AI Chatbot supports the generation of business diagrams, explicitly including PERT charts, within the modeling environment.
Pert Chart Tool – Visual Paradigm Online: A powerful online tool designed to help project managers visualize task dependencies, estimate timelines, and manage project schedules effectively.
Complete PERT Chart Tutorial – Visual Paradigm: A step-by-step tutorial guiding users through creating and using PERT charts in the cloud to plan and manage complex projects efficiently.
Pert Chart User Guide – Visual Paradigm: Detailed documentation covering how to create, edit, and utilize PERT charts within the desktop software for robust project management.
Free PERT Chart Templates – Visual Paradigm: Access a collection of professionally designed templates to kickstart project planning with minimal setup.
Pert Chart Tutorial – Visual Paradigm Knowledge Base: An in-depth resource explaining the purpose, construction, and application of PERT charts in real-world project management scenarios.
Enhanced PERT Chart Features – Visual Paradigm: Explore advanced capabilities such as dynamic scheduling, critical path analysis, and seamless integration with project timelines.
Project Management Guide – Visual Paradigm User Guide: A comprehensive guide to the platform’s project management suite, including PERT charts, Gantt charts, and resource allocation tools.
Pert Chart for Project Management – Cybermedian: This article provides practical insights and real-world online examples for using PERT charts to improve project planning.
Integrating PERT Charts with RACI Roles in Task Management: A practical guide on combining PERT charts with RACI roles to enhance timeline accuracy and accountability in management workflows.
Visual Paradigm AI Suite: A Comprehensive Guide: This overview details how the platform’s AI Chatbot supports the generation of business diagrams, explicitly including PERT charts, within the modeling environment.