


Understanding the Dynamic Aspect of Systems
In the realm of software architecture and business process analysis, UML Behavior Modeling plays a pivotal role by capturing the dynamic aspect of a system. While static modeling focuses on the stationary structure—defining objects, attributes, and relationships—behavioral modeling brings the system to life. It illustrates the operational logic, intricate message flows, and state changes that occur over time as the system executes.

Behavior modeling is essential for developers and stakeholders to understand how different elements interact to achieve specific goals. It moves beyond what the system is composed of, to explain how it functions under various scenarios.
Core Components of Behavior Modeling
Behavioral modeling utilizes a suite of specialized diagrams, each designed to offer a unique perspective on system activity and interactivity. Below are the primary concepts and diagrams used to articulate system behavior:
1. Use Case Modeling
Use Case diagrams are the foundation for gathering functional requirements. They identify external “actors” (which can be human users or external systems) and map their interactions with the system to achieve specific goals.
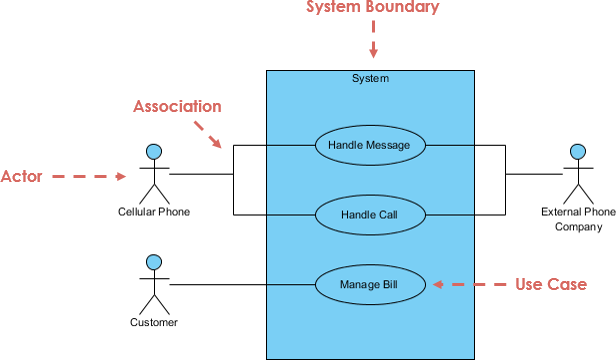
Example: Consider a library management system. A “Member” actor interacts with the system to initiate a “Borrow Book” use case, outlining the high-level goal without detailing the internal code logic.
2. Activity Diagrams
When the goal is to model procedural logic and workflows, Activity Diagrams are the standard. They illustrate the sequence of actions, decisions, loops, and parallel paths required to complete a process.
Example: In an e-commerce order fulfillment process, an Activity Diagram visualizes the flow branching into different actions based on conditions, such as whether a payment is successful or if items are currently out of stock.
3. Sequence Diagrams
Sequence Diagrams are used to visualize the time-ordered interaction between specific objects. They show the exact order of messages passed between entities to execute a specific scenario or algorithm.
Example: For a user logging into a website, a Sequence Diagram would depict the flow of credentials moving from the User to the User Interface, and subsequently to the Server for validation, highlighting the chronological progression of the event.
4. State Machine Diagrams
To describe the lifetime behavior of a single object, State Machine Diagrams are employed. These models detail the various states an object can exist in and the specific events that trigger transitions between these states.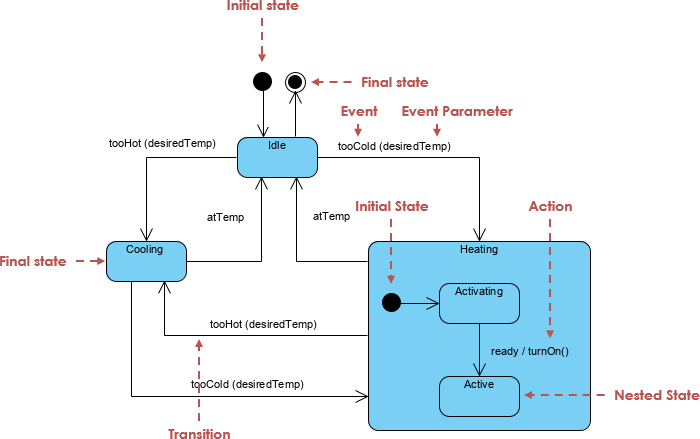
Example: A “Loan” object in a banking system may transition from “Applied” to “Approved” or “Rejected,” with the transition triggered by a specific event like a credit score check.
5. Collaboration (Communication) Diagrams
Similar to Sequence Diagrams, Collaboration Diagrams describe interactions between objects. However, rather than focusing on time, they emphasize the structural organization of the objects that participate in the message flow, providing a spatial view of the interaction.

Accelerating Design with Visual Paradigm’s AI Ecosystem
Traditionally, creating these behavioral models was a labor-intensive chore requiring manual drafting. The Visual Paradigm AI ecosystem has transformed this process into an intuitive, conversational workflow, allowing architects to focus on strategic design rather than drawing mechanics.
Natural Language to Diagram Generation
The entry point to this ecosystem is Natural Language Articulation via an AI Chatbot. Users can describe desired behaviors in plain English. For instance, prompting the AI with “Create a sequence diagram for an e-commerce checkout process including cart service, payment gateway, and inventory” triggers the Instant Diagram Generation engine. The AI processes the text and produces a standardized, technically valid UML diagram in seconds, automatically handling complex logic like branching, error states, and parallel fragments.
Iterative Conversational Refinement
Unlike generic AI image generators that often require a full redraw for minor changes, Visual Paradigm’s AI supports Diagram Touch-Up. This allows for conversational refinement where the AI maintains the persistent visual structure of the model. Users can simply type commands like “Add a two-factor authentication step” or “Add a loop for payment retries,” and the diagram updates intelligently.
From Requirements to Artifacts
The ecosystem includes specialized tools like the Use Case to Activity Diagram Generator, which systematically converts textual requirements into visual workflows. This automation guides users through identifying actors and detailing flows.
Furthermore, the AI acts as a design consultant, offering architectural critique and insights. It analyzes behavioral models to identify potential risks, such as single points of failure or logic gaps, and can suggest industry-standard patterns like MVC (Model-View-Controller).
Functional Integration
Crucially, the diagrams generated are not static images. They are functional artifacts that can be imported into Visual Paradigm Desktop. This allows for advanced editing, team collaboration, and even code engineering, bridging the gap between vague requirements and precise technical blueprints.