Now Reading: AI Activity Diagram Insights: Refining Manufacturing Quality Control Process
-
01
AI Activity Diagram Insights: Refining Manufacturing Quality Control Process


AI Activity Diagram Insights: Refining Manufacturing Quality Control Process
Inconsistent quality control processes can lead to costly defects, rework, and customer dissatisfaction—especially in high-stakes industries like electronics manufacturing. Traditional methods of documenting and analyzing workflows often fall short, leaving gaps in inspection, defect classification, and decision-making. But what if you could visualize and optimize your entire quality control process in minutes, not days?
This case study explores how an electronics contract manufacturer used Visual Paradigm Desktop’s AI Diagram Generation to transform their quality control workflow. By converting complex process descriptions into clear, actionable Activity Diagrams, the team identified bottlenecks, standardized procedures, and reduced scrap rates by 22%. Whether you’re a quality engineer, process analyst, or operations manager, you’ll learn how AI-powered diagramming can bring clarity, consistency, and continuous improvement to your processes.
Read on to see how AI-generated Activity Diagrams can help you:
- Map out every step of your quality control process
- Spot inefficiencies and decision points that impact product quality
- Collaborate more effectively with cross-functional teams
- Ensure compliance and traceability with visual documentation
Defining Activity Diagrams
An Activity Diagram is a type of UML (Unified Modeling Language) diagram used to represent workflows, business processes, and system behaviors. Unlike static flowcharts, Activity Diagrams provide a dynamic view of how activities and decisions flow through a process, making them ideal for modeling complex operations like manufacturing quality control.
At their core, Activity Diagrams consist of:
- Actions: Individual steps or tasks within the process (e.g., “Inspect PCB,” “Classify Defect”)
- Control Flows: Arrows that show the sequence and direction of activities
- Decision Nodes: Diamonds that represent branching logic (e.g., “Pass/Fail,” “Rework/Scrap”)
- Merge Nodes: Points where parallel paths reconnect
- Swimlanes: Horizontal or vertical lanes that assign responsibilities to specific roles or departments
For quality control, Activity Diagrams are particularly valuable because they:
- Clarify the sequence of inspections, tests, and decisions
- Highlight dependencies between steps, such as waiting for test results before proceeding
- Reveal redundant or unnecessary steps that slow down production
- Serve as a single source of truth for training, audits, and process improvement initiatives
Traditionally, creating these diagrams required manual input from process experts, iterative reviews, and constant updates as procedures evolved. This approach is time-consuming and prone to human error. AI Diagram Generation changes the game by automating the creation of accurate, up-to-date diagrams from natural language descriptions or existing documentation. With tools like Visual Paradigm Desktop, teams can generate, refine, and share Activity Diagrams in a fraction of the time, ensuring everyone works from the same playbook.
In manufacturing, where precision and repeatability are paramount, Activity Diagrams help bridge the gap between written procedures and real-world execution. They make it easier to onboard new staff, troubleshoot issues, and maintain compliance with industry standards such as ISO 9001 or IATF 16949.
Inside Refining Manufacturing Quality Control Process

The electronics contract manufacturer in this case study faced a common challenge: inconsistent handling of inspection, defect classification, rework, and scrap decisions across multiple production lines. Despite having written procedures, the lack of a visual, standardized process map led to miscommunication, delays, and variable quality outcomes.
The quality team decided to leverage Visual Paradigm Desktop’s AI Diagram Generation to create a comprehensive Activity Diagram of their end-to-end quality control process. Here’s how they approached it:
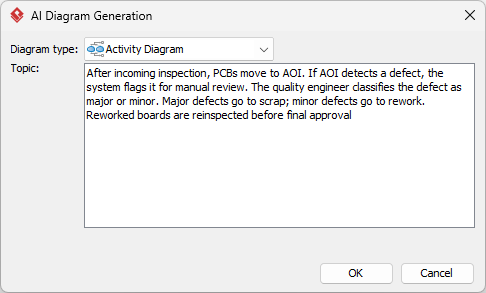
Step 1: Process Description
The team started by documenting their current workflow in plain language, including all inspection points, decision criteria, and handoffs between departments. For example:
“After incoming inspection, PCBs move to AOI. If AOI detects a defect, the system flags it for manual review. The quality engineer classifies the defect as major or minor. Major defects go to scrap; minor defects go to rework. Reworked boards are reinspected before final approval.”
Step 2: AI Generation
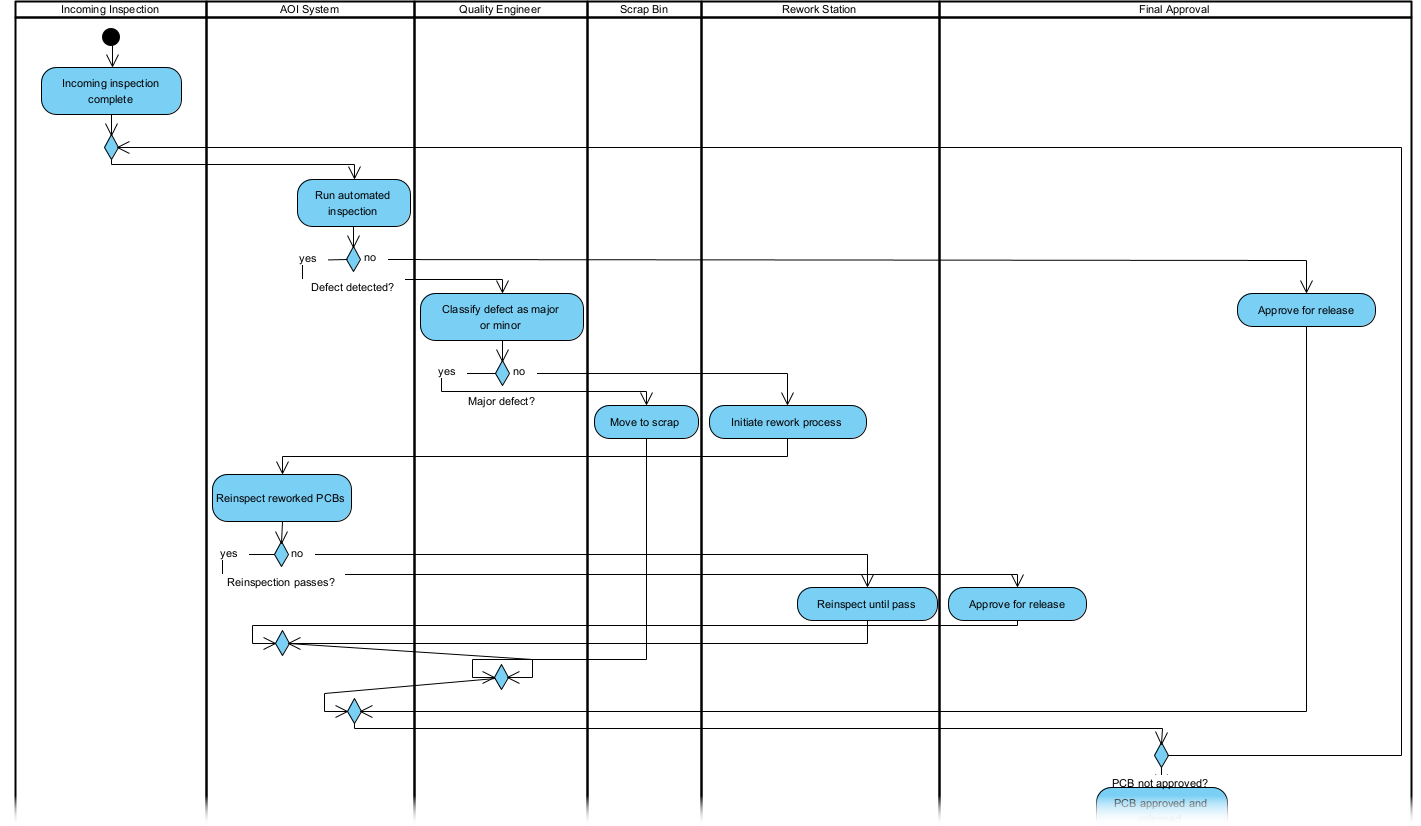
Using Visual Paradigm Desktop, they input this description into the AI Diagram Generation tool.
Within seconds, the AI produced a draft Activity Diagram, complete with actions, decision nodes, and swimlanes. The tool automatically identified missing steps—such as the need for a “Hold” status for boards awaiting engineering review—and suggested improvements for clarity.
Step 3: Collaborative Review
The draft diagram was shared with inspection supervisors, engineers, and production managers. Using Visual Paradigm’s collaborative features, the team annotated the diagram, added swimlanes for each role, and refined the logic for defect classification.
Step 4: Integration & Training
The finalized diagram was exported as a PDF and embedded in the company’s quality management system. New hires now use the diagram during onboarding, and the live version in Visual Paradigm Desktop is updated whenever procedures change.
The result? A 22% reduction in scrap rates within three months, thanks to clearer decision-making and fewer oversights. The diagram also became a key tool for root cause analysis during non-conformance investigations, helping teams trace issues back to specific process steps.
AI Generation Advantages
- Speed: Generate a first draft in seconds, not hours
- Accuracy: AI detects missing steps and suggests improvements
- Consistency: Everyone works from the same visual reference
- Collaboration: Real-time editing and comments streamline reviews
- Adaptability: Easily update diagrams as processes evolve
For this manufacturer, the biggest win was the ability to simulate “what-if” scenarios directly in the diagram. For example, they modeled the impact of adding a pre-AOI visual inspection step and found it would reduce false positives by 15%. The AI’s ability to highlight parallel processes (such as simultaneous AOI and functional testing) also revealed opportunities to optimize cycle time.
By making the quality control process visible and interactive, the team shifted from reactive firefighting to proactive process management. The Activity Diagram became a living document, not just a static picture.
Step-by-Step AI in Visual Paradigm
- Open Visual Paradigm Desktop and navigate to the AI Diagram Generation feature.
- Select “Activity Diagram” as your diagram type.
- Input your process description in natural language or paste from existing documentation.
- Review the AI-generated draft.
- Customize the diagram by dragging elements, adjusting labels, or adding color coding.
- Export or share the diagram in your preferred format (PDF, image, or interactive link).
Visual Paradigm’s AI doesn’t just draw shapes—it understands process logic. If you describe a decision point, it will automatically create branches. If you mention a role, it will suggest swimlanes. This context-aware generation saves time and reduces the risk of oversights.
Post-Generation Mastery
Edits & Tweaks
Even the best AI-generated diagram may need fine-tuning. Visual Paradigm Desktop makes it easy to:
- Adjust the layout for readability
- Add or remove steps with a single click
- Change the style (colors, fonts, line types) to match your brand
- Link diagram elements to external documents or data sources
Modeling Depth
To maximize the value of your Activity Diagram, consider these advanced techniques:
Swimlanes for Clarity
Assign each activity to a specific role or department using swimlanes. This makes it clear who is responsible for each step and helps identify handoff delays. In the quality control example, swimlanes for Inspection, Engineering, and Production made it obvious where bottlenecks were occurring.
Decision Tables
For complex decision logic, use Visual Paradigm’s decision table feature to document all possible outcomes. For example, the defect classification process could be expanded to show how different defect types (solder bridges, missing components, etc.) are handled.
Simulation
Use the simulation mode to walk through the process step-by-step. This is especially useful for training new inspectors or validating changes before implementation.
Integration with Other Diagrams
Link your Activity Diagram to related models, such as Use Case Diagrams for user interactions or Class Diagrams for data structures. This creates a connected ecosystem of process documentation.
Version Control
Track changes over time with Visual Paradigm’s versioning system. This is critical for audits and continuous improvement initiatives, as it allows you to compare current and past processes.
By combining AI generation with these advanced features, you can create Activity Diagrams that are not just accurate, but actionable. The manufacturer in this case study now uses their diagram as a foundation for Six Sigma projects, ensuring data-driven decisions are always tied to the actual process flow.
Outcomes & Insights
- 22% reduction in scrap rates due to clearer decision criteria
- 30% faster onboarding for new quality inspectors
- 50% less time spent documenting and updating procedures
- Improved compliance with ISO 9001 through visual process evidence
The most significant insight was the power of visualization to drive accountability. When everyone could see the process—and their role in it—communication improved, and finger-pointing decreased. The Activity Diagram became a shared language for discussing quality issues and solutions.
Frequently Asked Questions
- Is the AI output always perfect?
- The AI generates a highly accurate first draft based on your input, but it’s designed to be a starting point. You should always review and refine the diagram to ensure it matches your real-world process. Visual Paradigm’s tools make this easy, with suggestions for missing steps and logical inconsistencies.
- What editions support AI Diagram Generation?
- AI Diagram Generation is available in Visual Paradigm Desktop Standard and above. For enterprise teams, the Professional and Enterprise editions offer additional collaboration and integration features.
- How customizable is the generated Activity Diagram?
- You have full control over every element. Change shapes, colors, labels, and layout to fit your needs. The AI respects your edits and can even learn from them to improve future suggestions.
- Can I use this for team projects?
- Yes! Visual Paradigm Desktop supports real-time collaboration, version control, and role-based access, making it ideal for cross-functional teams. Multiple users can edit and comment on the same diagram simultaneously.
Conclusion
In manufacturing, quality isn’t just a department—it’s a culture. By using AI-generated Activity Diagrams, you can make your quality control processes transparent, consistent, and continuously improving. Visual Paradigm Desktop’s AI Diagram Generation turns complex workflows into clear, actionable visuals, helping your team work smarter, not harder.
Ready to see how AI can transform your processes? Try Visual Paradigm Desktop today and start mapping your quality control workflow in minutes.