


Creating a robust system requires more than just writing code. It demands a precise understanding of how information moves through an organization. At the heart of this understanding lies the Data Flow Diagram, or DFD. This visual tool bridges the gap between abstract business needs and concrete technical specifications. When you successfully translate business requirements into a DFD, you create a shared language for stakeholders, developers, and analysts.
This guide walks you through the disciplined process of converting high-level business needs into structured diagrams. We will explore the necessary steps, the core elements involved, and the common pitfalls to avoid. By following this methodology, you ensure that the final system accurately reflects the operational reality.
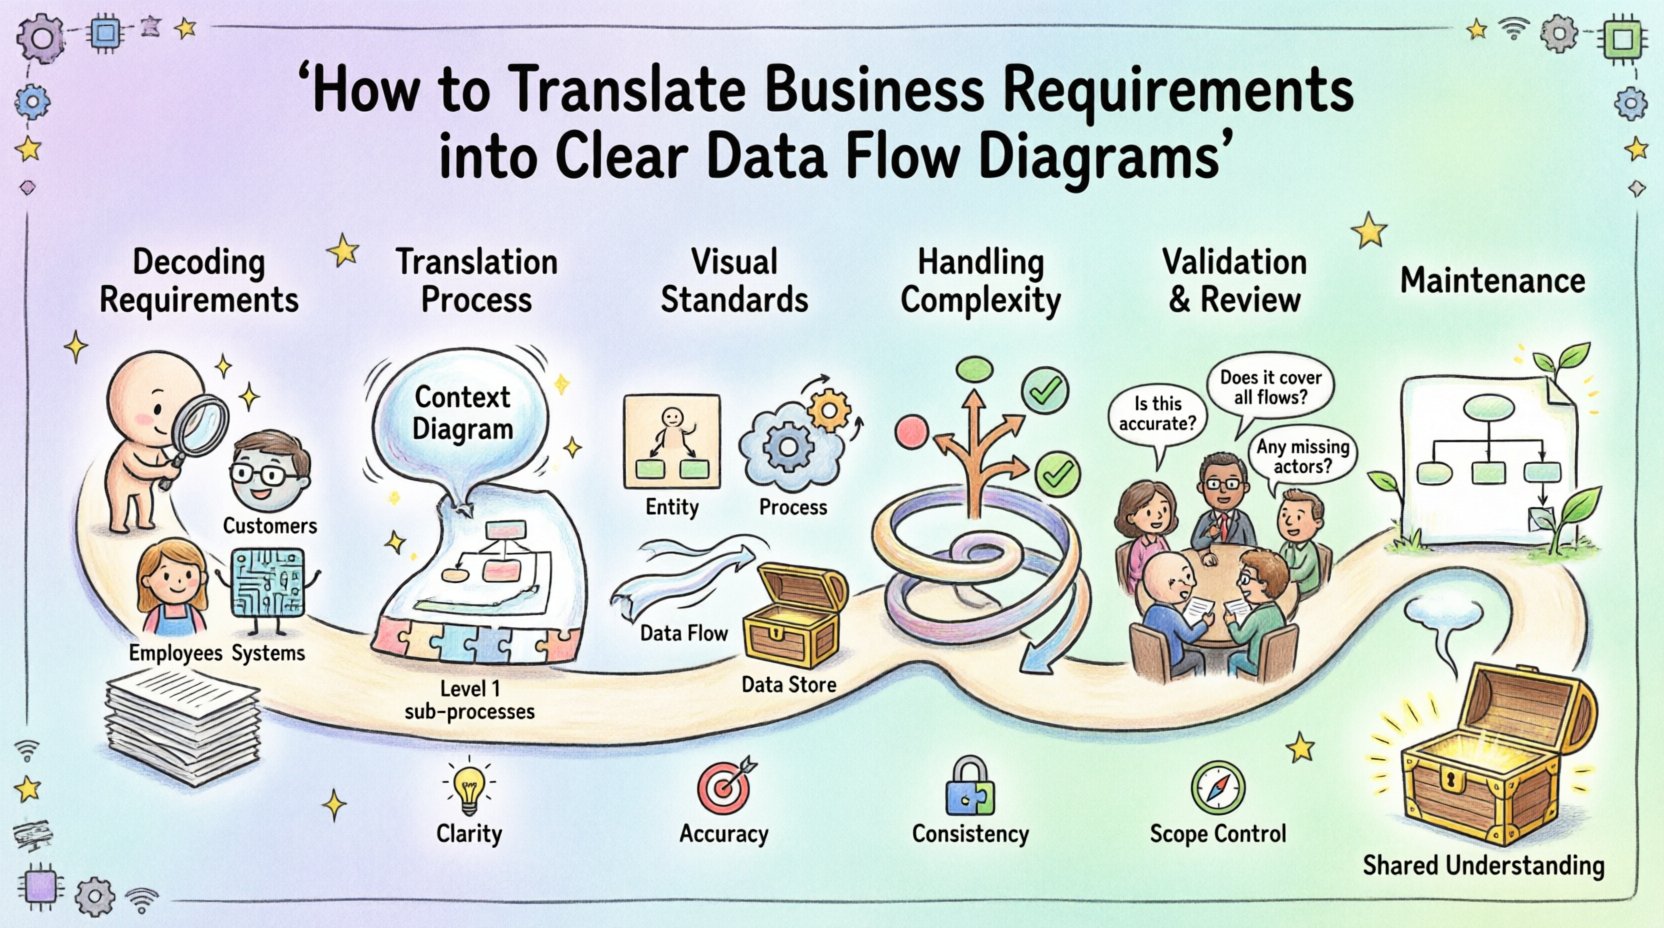
Understanding the Connection Between Requirements and DFDs 🔗
Business requirements are statements of what the organization needs to achieve. They describe processes, data needs, and user interactions without necessarily detailing the technical implementation. A Data Flow Diagram serves as the visual representation of these statements. It shows where data comes from, how it is processed, where it is stored, and where it goes next.
When you map requirements to a DFD, you are essentially auditing the flow of information. This process reveals gaps in logic, missing data stores, or ambiguous process definitions before any technology is selected. It forces a conversation about the what rather than the how.
Why This Translation Matters 🎯
- Clarity: Stakeholders often struggle with technical jargon. A DFD uses visual symbols to make complex flows understandable.
- Accuracy: It validates that every piece of data mentioned in a requirement has a defined path.
- Consistency: It ensures that different parts of the system do not contradict one another regarding data ownership.
- Scope Control: It helps identify what is in scope for the current project and what belongs to a future iteration.
Phase 1: Decoding Business Requirements 📋
The foundation of a good diagram is high-quality input. You cannot draw a map if you do not know the territory. The first step involves gathering and analyzing the raw material provided by the business.
1. Identify External Entities
Start by listing who or what interacts with the system from the outside. These are the sources and destinations of your data. In the context of requirements, look for mentions of users, departments, or external systems.
- Customers: Do they place orders? Do they receive reports?
- Employees: Who approves transactions? Who inputs data?
- External Systems: Are there APIs involved? Do you pull data from a third-party service?
- Regulators: Is there data that must be reported to government bodies?
Every entity identified here becomes a square or circle on your diagram. If a requirement mentions a user action, identify the user entity. If it mentions a report being sent, identify the recipient entity.
2. Extract Data Flows
Look for verbs in your requirement documents. Verbs usually indicate movement. Phrases like “submit a form,” “generate a report,” or “update inventory” signal a flow of information.
- Input Flows: Data entering the system. Example: “Customer submits order details.”
- Output Flows: Data leaving the system. Example: “System sends confirmation email.”
- Internal Flows: Data moving between processes within the system.
3. Define Data Stores
Requirements often mention keeping records. If data persists beyond the immediate transaction, it belongs in a data store. Look for keywords like “save,” “archive,” “record,” “history,” or “database.”
- Transaction Logs: Records of what happened.
- Master Files: Static data like product lists or user profiles.
- Working Files: Temporary data used during processing.
Phase 2: The Translation Process 🛠️
Once you have gathered the raw requirements, the actual translation begins. This phase requires discipline. You must resist the urge to jump to technical solutions. Focus on the logical flow.
Step 1: Create the Context Diagram 🌍
Start with a high-level view. This is often called the Context Diagram or Level 0 DFD. It shows the entire system as a single process bubble and connects it to all external entities.
- Draw the System: Represent the whole application as one circle or rounded rectangle.
- Add Entities: Place all identified external entities around the circle.
- Connect Flows: Draw arrows between entities and the central process. Label each arrow with the data moving.
- Verify: Ensure every entity has at least one incoming or outgoing flow.
This diagram answers the question: “What is the system boundary?” It defines the perimeter of your work.
Step 2: Decompose into Level 1 DFD 🧩
The context diagram is too high-level to show internal logic. You must break the single process bubble into major sub-processes. These sub-processes represent the main functional areas of the system.
- Identify Major Functions: If the system handles orders, break it down into “Receive Order,” “Process Payment,” and “Ship Goods.”
- Map Data Stores: Draw lines between processes and data stores. This shows where information is saved.
- Refine Flows: Ensure every arrow entering a process also exits it, unless it is a validation error or a log entry.
Step 3: Numbering and Naming 🏷️
Consistency is key for readability. Use a standard numbering scheme for your processes.
- Level 0: The single central process (e.g., 0.0).
- Level 1: Major sub-processes (e.g., 1.0, 2.0, 3.0).
- Level 2: Detailed steps within a Level 1 process (e.g., 1.1, 1.2).
Names should be action-oriented. Use a verb followed by a noun. For example, “Calculate Tax” is better than “Tax Calculation.” This aligns with the dynamic nature of data flow.
Phase 3: Visual Standards and Symbols 📐
To ensure the diagram is universally understood, adhere to standard notation. While tools vary, the core logic remains the same.
| Element | Symbol Shape | Meaning | Example |
|---|---|---|---|
| External Entity | Rectangle or Square | Source or Destination of data outside the system | Customer, Bank, Vendor |
| Process | Circle or Rounded Rectangle | Transformation of data | Validate Order, Calculate Total |
| Data Flow | Arrow | Movement of data between elements | Order Details, Payment Receipt |
| Data Store | Open Rectangle or Parallel Lines | Passive storage of data | Order Database, User Files |
Understanding the Rules of Movement 🔄
There are strict logical rules governing how these elements connect. Violating them creates an impossible system design.
- No Data Flow Between Entities: External entities cannot talk to each other directly without passing through the system.
- Process to Process: Data must flow between two processes or a process and a store.
- Data Store Interaction: You must have a flow into a store to save data, and a flow out to read it. You cannot skip the process step.
- Input/Output Balance: Every process must have at least one input and one output. A process that eats data but produces nothing is a “black hole.” A process that creates data from nothing is a “miracle.”
Phase 4: Handling Complexity and Exceptions ⚠️
Real-world business requirements are rarely linear. They involve decisions, loops, and exceptions. A clear DFD must account for these scenarios.
1. Decision Points
When a requirement includes a condition, such as “If the order is over $1000, require manager approval,” this creates a branching path.
- Split Flows: Use separate arrows for different outcomes. Label them clearly (e.g., “Approved” vs “Rejected”).
- Logical Operators: Sometimes you need to combine data flows. This is represented by a fork in the line.
2. Iterative Loops
Some processes require repetition. For instance, a “Search Product” function might loop until the user finds what they need.
- Feedback Loops: Draw a line from a later stage back to an earlier process. This indicates a revision or retry.
- Termination: Ensure there is a clear exit path so the loop does not run forever.
3. Data Validation
Requirements often specify data quality checks. “Ensure email format is valid.”
- Error Flows: Create a specific flow for invalid data. It should go to an error log or back to the user entity for correction.
- Correction Process: If the user must fix the data, draw a new process for “Data Correction” before the original process continues.
Phase 5: Validation and Review ✅
Once the diagram is drafted, it must be validated. This step ensures the diagram matches the original requirements and makes logical sense.
1. Walkthrough with Stakeholders
Schedule a session with the business users. Do not show them the raw diagram immediately. Explain the story of the data flow.
- Trace a Transaction: Pick a specific scenario (e.g., “A new customer places an order”). Walk through every step on the diagram.
- Ask Questions: “Does the data go to the right store here?” “Is there any step missing in this flow?”
- Listen for Confusion: If a stakeholder hesitates, that indicates an ambiguity in the diagram or the requirements.
2. Technical Feasibility Check
After business validation, involve technical leads. They can spot potential implementation hurdles.
- Data Volume: Are there flows that suggest massive data transfers that might require optimization?
- Security: Are sensitive data flows protected? Does the diagram show encryption or access controls?
- Performance: Are there too many sequential processes that could cause bottlenecks?
3. Consistency Check
Ensure the Level 1 diagram balances with the Context Diagram.
- Input/Output Match: The total input and output flows in Level 1 must match the flows in the Context Diagram.
- Entity Consistency: Ensure the same entity names are used throughout all levels of the diagram.
Common Pitfalls to Avoid 🚫
Even experienced analysts make mistakes. Being aware of common errors helps you maintain diagram integrity.
1. The “Control Flow” Trap
DFDs show data flow, not control flow. Do not draw arrows to indicate “when” something happens. Only draw arrows for data moving.
- Bad: Arrow saying “Start” pointing to a process.
- Good: An external entity sending a “Start Request” data packet.
2. Over-Complicating the Diagram
It is tempting to put every single detail on one page. This leads to a “hairball” diagram that no one can read.
- Use Decomposition: If a process is too complex, create a new sub-diagram for it.
- Focus on Logic: Do not include UI design details like button clicks. Focus on the underlying data movement.
3. Ignoring Data Stores
Some diagrams focus only on processes and ignore where data lives. This is a critical oversight.
- Trace Persistence: Ensure every piece of data that needs to be remembered has a store.
- Label Stores: Name data stores clearly (e.g., “Active Users” vs “Archived Users”).
4. Merging Entities
It is common to lump all users into one box. However, a “Manager” has different data requirements than a “Customer.”
- Differentiate Roles: Split entities if their data inputs or outputs differ significantly.
- Security Context: Different entities imply different access levels. Keep them distinct for security planning.
Phase 6: Maintenance and Evolution 🔄
A DFD is not a one-time deliverable. It is a living document that must evolve with the business.
1. Change Management
When a requirement changes, the diagram must change. Do not update the code without updating the map.
- Impact Analysis: If a new data source is added, trace where it goes. Does it affect existing processes?
- Version Control: Keep versions of your diagrams. This helps in auditing what changed and when.
2. Documentation Integration
The diagram should be supported by text. Use a data dictionary to define the specific fields in each data flow.
- Define Fields: If a flow is “Order Details,” list the fields (e.g., SKU, Quantity, Price).
- Link to Specs: Reference the diagram in your technical specifications.
Final Thoughts on System Design 🧠
Translating business requirements into Data Flow Diagrams is a critical skill in system analysis. It requires patience, attention to detail, and a commitment to clarity. By following these steps, you create a blueprint that guides development and ensures the final product meets business goals.
Remember that the goal is not just to draw lines. The goal is to understand the system. When you can explain the data flow to a non-technical stakeholder, you have succeeded. This shared understanding reduces risk, prevents scope creep, and builds a foundation for a successful project.
Keep your diagrams clean, your labels accurate, and your logic sound. Treat the DFD as the truth source for how information moves through your organization. With practice, this translation process becomes second nature, allowing you to focus on solving complex business problems rather than getting lost in technical details.