


Designing a robust microservices architecture requires more than just splitting code into smaller pieces. It demands a clear understanding of how information moves through the system. Without a structured approach, distributed systems often become tangled webs of dependencies that are difficult to maintain and scale. This is where the Data Flow Diagram (DFD) becomes an essential tool for architects. By visualizing the movement of data, teams can define service boundaries with precision and ensure that the underlying data logic remains consistent across the platform.
This guide explores how to leverage DFDs during the planning phase of microservices implementation. We will examine the hierarchy of diagrams, the identification of critical boundaries, and the strategies for managing data ownership. The goal is to provide a methodical framework for system design that prioritizes clarity and maintainability.
🧩 Understanding the Role of DFDs in Distributed Systems
A Data Flow Diagram represents the flow of information through a system. Unlike a flowchart, which focuses on control flow and decision logic, a DFD emphasizes data transformation and storage. In the context of microservices, this distinction is vital. Microservices are essentially independent processing units that exchange data. Mapping this exchange visually helps stakeholders understand the impact of changes.
Core Components of a DFD
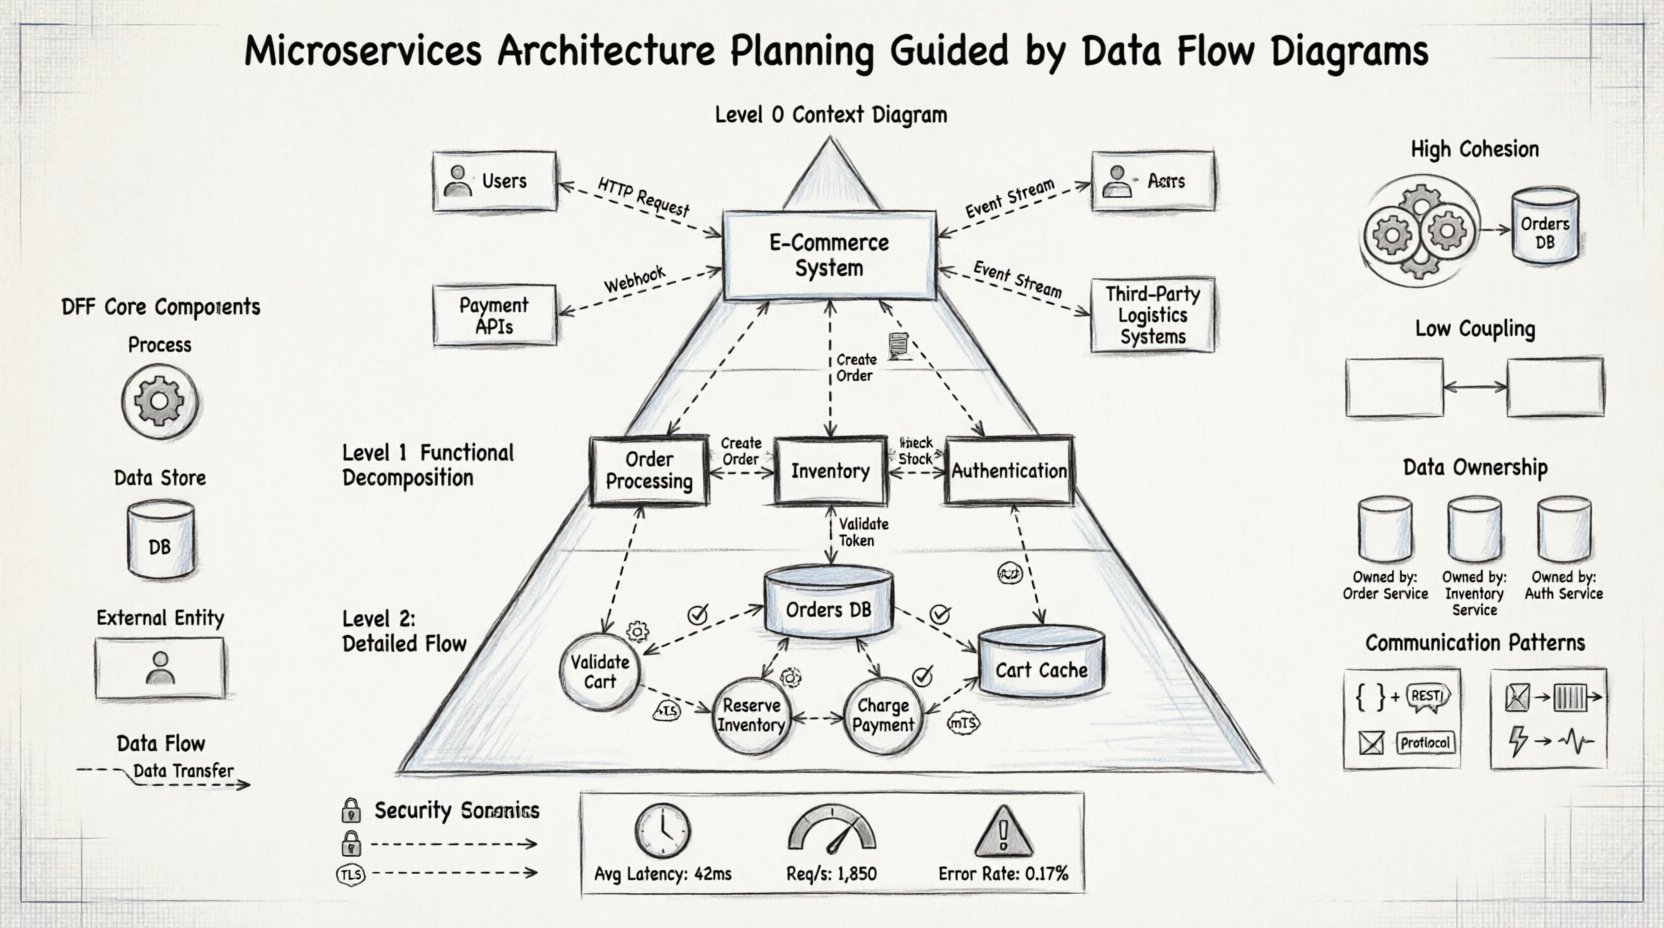
Before applying DFDs to architecture, one must understand the fundamental symbols used:
- Processes: Represent transformations of data. In microservices, these often equate to specific service functions or APIs.
- Data Stores: Locations where data is held at rest. These translate to databases, caches, or file systems.
- External Entities: Sources or destinations of data outside the system. This includes users, third-party systems, or legacy applications.
- Data Flows: The movement of data between processes, stores, and entities. These represent the network traffic or message queues between services.
📊 The Hierarchy of Planning Diagrams
A comprehensive architecture plan requires multiple levels of abstraction. Starting with a high-level overview and drilling down into specific details ensures that no critical data path is overlooked. This hierarchical approach aligns naturally with the layered design of microservices.
Level 0: The Context Diagram
The Level 0 diagram, often called the Context Diagram, provides the broadest view. It represents the entire system as a single process and identifies all external entities interacting with it. This is the first step in planning because it defines the scope.
- Identify Boundaries: Clearly mark what is inside the system and what is outside.
- External Interfaces: List every point of entry and exit for data.
- Primary Inputs/Outputs: Determine the main data triggers for the system.
For microservices, this level helps answer the question: “What is the system doing for the user?” It sets the stage for decomposition.
Level 1: Major Functional Decomposition
Once the context is established, the single process is exploded into major sub-processes. In a microservices context, these sub-processes often hint at the initial service candidates. This level breaks down the system into logical domains.
- Domain Alignment: Group processes by business capability (e.g., Order Processing, Inventory Management, User Authentication).
- Service Candidates: Each major process becomes a potential microservice.
- Inter-Service Communication: Identify the data flows between these major domains.
Level 2: Detailed Flow Analysis
The final level of detail focuses on specific functions within a service. This is where data validation, transformation, and storage logic are mapped. It ensures that the internal logic of a service is coherent before implementation begins.
🏗️ Mapping Data Flows to Service Boundaries
One of the most critical challenges in microservices architecture is defining service boundaries. If boundaries are drawn incorrectly, services become tightly coupled, leading to the “distributed monolith” anti-pattern. DFDs assist in drawing these lines by highlighting data dependencies.
Identifying Cohesion
Services should exhibit high cohesion, meaning all functions within a service work closely together on a specific data set. DFDs help visualize this by grouping processes that share the same data stores and flows.
- Grouped Processes: If Process A and Process B always exchange data directly without external triggers, they likely belong to the same service.
- Shared Data Stores: Processes accessing the same data store should be evaluated for potential consolidation.
Minimizing Coupling
Coupling refers to the degree of interdependence between services. DFDs reveal coupling by showing how many data flows cross the proposed boundary. The goal is to minimize the number of data flows crossing service boundaries.
- Direct Connections: Reduce the number of direct data flows between services.
- Indirect Connections: Prefer asynchronous messaging or event-driven architectures to decouple services.
🗄️ Managing Data Ownership and Consistency
In a monolithic database, data consistency is handled via transactions. In microservices, each service typically owns its data. DFDs are instrumental in clarifying ownership. By mapping data flows to stores, architects can assign ownership to specific processes.
The Database Per Service Pattern
Each microservice should manage its own data store. DFDs help identify which data belongs to which service by tracking where the data originates and where it is consumed.
- Source of Truth: The process that writes the data owns the data store.
- Read Access: Other processes can read the data via defined flows (APIs), but cannot modify it directly.
Consistency Models
Distributed systems often rely on eventual consistency rather than immediate consistency. DFDs highlight where consistency is critical versus where it can be relaxed.
- Strong Consistency: Required for financial transactions or inventory updates. These flows are marked as synchronous.
- Eventual Consistency: Acceptable for user profiles or logging. These flows are often asynchronous.
🔗 Communication Patterns and Integration
Once services are defined, the architecture must define how they talk to each other. DFDs distinguish between different types of data flows, which informs the choice of communication technology.
Request-Reply vs. Event-Driven
Not all data flows require an immediate response. DFDs help categorize flows based on their timing requirements.
- Synchronous Flows: Used when the downstream process needs data immediately to proceed. These typically map to REST or gRPC APIs.
- Asynchronous Flows: Used for background processing or notifications. These map to message queues or event buses.
⚠️ Common Pitfalls in DFD-Based Planning
While DFDs are powerful, they are prone to misinterpretation if not used correctly. Architects should be aware of common mistakes that can derail the planning process.
Pitfall 1: Over-Detailed Context
Starting with too much detail at the Context level can obscure the high-level view. Keep Level 0 simple. Only add complexity when moving to Level 1 and 2.
Pitfall 2: Ignoring Non-Functional Requirements
DFDs focus on data, not performance or security. While mapping flows, consider latency requirements and security boundaries. A data flow might be technically possible but violate security policies.
Pitfall 3: Circular Dependencies
DFDs can reveal circular data flows where Service A calls Service B, which calls Service A. This creates a deadlock or infinite loop. These loops must be broken by restructuring the data ownership.
📋 Comparative Analysis of DFD Levels
To better understand how DFD levels map to architectural decisions, refer to the table below.
| DFD Level | Focus Area | Architectural Output |
|---|---|---|
| Context (Level 0) | System Scope | Service Boundary Definition |
| Functional (Level 1) | Major Domains | Service Catalog & API Contracts |
| Logical (Level 2) | Internal Logic | Data Models & Validation Rules |
| Physical | Infrastructure | Deployment Topology & Network Config |
🔄 Iterative Refinement and Maintenance
Architecture is not a one-time event. As the business evolves, data flows change. DFDs serve as living documentation that should be updated alongside the codebase.
Versioning Diagrams
Just as APIs are versioned, DFDs should be versioned to track architectural changes over time. This helps teams understand why certain decisions were made in the past.
- Change Logs: Document every modification to a data flow or process.
- Impact Analysis: Use the diagram to assess how a change in one service affects others.
Automated Validation
While manual diagrams are useful, automated validation can ensure the implementation matches the design. Tools can verify that actual network traffic aligns with the defined flows in the DFD.
🛡️ Security Considerations in Data Flows
Security is often an afterthought in design, but DFDs allow it to be integrated from the start. Every data flow represents a potential attack vector.
Defining Trust Zones
Mark areas of the diagram that require different security levels. Internal flows might be trusted, while external flows require encryption and authentication.
- External Flows: Require TLS, API keys, or OAuth tokens.
- Internal Flows: Require mutual TLS or service-to-service authentication.
Data Classification
Label data flows based on sensitivity. Sensitive data (PII, financial) requires stricter controls than public data.
- High Sensitivity: Encrypt data at rest and in transit.
- Low Sensitivity: Standard encryption protocols are sufficient.
📈 Measuring Success with DFDs
How do you know if the architecture is working? DFDs provide a baseline for measurement. By comparing actual data movement against the planned diagram, teams can identify bottlenecks.
Performance Metrics
- Latency: Measure time taken for data to traverse a flow.
- Throughput: Measure the volume of data moving between processes.
- Error Rates: Identify flows that frequently fail.
Optimization Opportunities
DFDs highlight redundant paths. If two services exchange the same data repeatedly, a caching layer or a shared read model might be introduced to optimize performance.
🚀 Conclusion on Strategic Planning
Using Data Flow Diagrams for microservices planning shifts the focus from code to information. It ensures that the architecture supports the business logic rather than the other way around. By adhering to a structured DFD approach, teams can create systems that are modular, maintainable, and scalable.
The process requires discipline. It demands that architects resist the urge to over-optimize prematurely and instead focus on clear boundaries and data ownership. When the DFD is accurate, the implementation follows naturally. This method reduces technical debt and creates a foundation for long-term growth.
Remember that the diagram is a tool for communication as much as design. It bridges the gap between technical teams and business stakeholders. When everyone understands how data moves, the entire organization can make better decisions regarding system capabilities and limitations.