


Effective project management relies heavily on precise boundaries. When defining what a system must do and what it must not do, clarity is essential. Data Flow Diagrams (DFDs) offer a visual language to articulate these boundaries with precision. By mapping how data moves through a system, teams can identify exactly where work begins and ends. This process anchors scope definition in tangible evidence rather than vague assumptions.
Scope control is often where projects drift. Without a visual reference, stakeholders might request changes that seem small but disrupt the entire architecture. DFDs provide a baseline. They show the inputs, outputs, processes, and data stores. When a new feature is proposed, its impact on the flow is immediately visible. This guide explores how to leverage Data Flow Diagrams for rigorous scope definition and ongoing control.
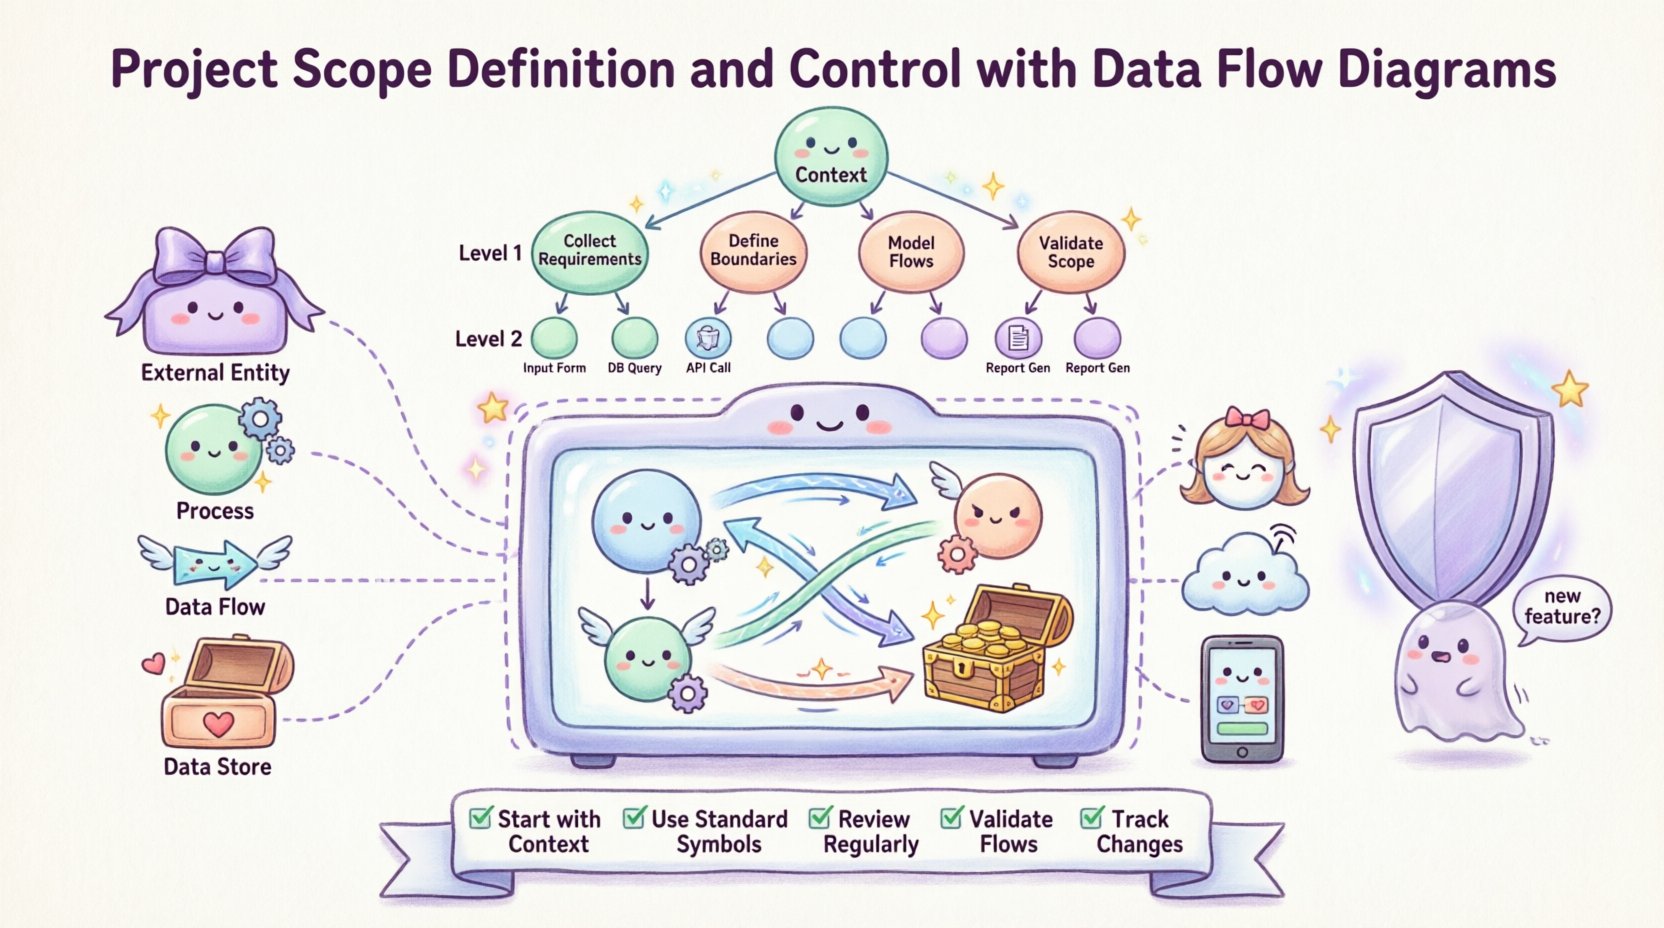
Understanding Data Flow Diagram Fundamentals 🧩
Before applying DFDs to scope management, one must understand their structure. A Data Flow Diagram is a graphical representation of the flow of data through an information system. It focuses on where data comes from, where it goes, and how it transforms.
The Four Essential Components 🏗️
- External Entities: These represent sources or destinations of data outside the system. In scope terms, these define the boundaries. If an entity is external, work related to it is often out of scope unless explicitly included.
- Processes: These are actions that transform input data into output data. Each process represents a unit of work. Counting and defining these processes is a direct way to quantify scope.
- Data Flows: These are arrows showing the movement of data. They connect entities to processes and processes to processes. A flow crossing the system boundary is a critical scope indicator.
- Data Stores: These represent where data is held for later use. Managing the creation and maintenance of these stores is a significant part of the project workload.
Types of DFDs for Scope Analysis 🔍
Different levels of detail serve different scope needs. A single diagram rarely suffices for a large project.
- Context Diagram (Level 0): This is the highest level view. It shows the entire system as one process and all external entities. It is the primary tool for defining the overall project perimeter. It answers the question: “What is the system?”
- Level 1 Diagram: This breaks the main process into major sub-processes. It defines the major modules or functional areas. This level helps in assigning responsibility and estimating effort.
- Level 2 Diagram: This decomposes Level 1 processes further. It is used for detailed design and specific task definition. Scope control at this level prevents feature creep in specific modules.
Mapping Scope to Data Flows 🗺️
Scope is often defined in text documents, which can be ambiguous. A DFD translates text into geometry. This visual translation reduces misinterpretation. The boundary of the system in a DFD is the physical manifestation of the project scope.
Identifying External Entities as Scope Markers 🚩
External entities are the anchors of scope. They include users, other systems, or physical devices. Every connection to an external entity represents a requirement.
- If a user interacts with the system, they are an external entity. The login process, the reporting function, and the data entry screen become requirements.
- If an external system sends data, an interface is required. This interface is a specific scope item.
- If data leaves the system to a third party, compliance and security become scope elements.
By listing all external entities early, the team can determine if any are being ignored. Missing an entity is a common cause of scope gaps. Conversely, adding an entity without approval is scope creep.
Setting System Boundaries Clearly 🛑
The line separating the system from the outside world is the scope boundary. In a DFD, this is the box containing all processes and data stores. Anything outside is out of scope.
- In Scope: All processes inside the box. All data stores inside the box.
- Out of Scope: All entities outside the box. All data flows originating or terminating outside the box.
When a stakeholder asks, “Can we also handle the billing for this?” you check the DFD. If the billing process is not inside the box, it is out of scope. If it is inside, it is in. This visual check removes debate.
Table: Scope Elements vs DFD Symbols 📋
| Scope Element | DFD Symbol | Implication for Control |
|---|---|---|
| External User | Rectangle (Entity) | Requires authentication, UI, and access control. |
| Data Input | Data Flow Arrow | Requires validation logic and error handling. |
| Processing Logic | Circle (Process) | Requires algorithm development and testing. |
| Storage Requirement | Open Rectangle (Store) | Requires database schema and backup strategy. |
| External Interface | Data Flow Crossing Boundary | Requires API design and security protocols. |
The Hierarchy of Scope in DFDs 🔻
Large projects require decomposition. A monolithic scope is hard to manage. Breaking the DFD down creates manageable chunks of scope.
Context Diagram as the Macro Scope 🌍
The Context Diagram defines the high-level agreement. It is signed off by the project sponsor. It establishes the “What” without the “How”. It prevents the team from getting lost in details before agreeing on the whole.
- Validation: Ensure all inputs and outputs are listed. If a key report is missing from the output flows, the scope is incomplete.
- Stakeholder Alignment: Walk through the diagram with stakeholders. Confirm that every arrow represents a business need.
Level 0 and 1 for Detail 📝
Once the macro scope is set, decompose it. Level 1 breaks the single process into major functions. This is where the bulk of the work is estimated.
- Process Count: Count the processes. Each process represents a development unit.
- Data Store Count: Count the stores. Each store represents a database table or file.
- Flow Density: High numbers of flows between processes indicate complexity. This area requires more testing and integration effort.
Controlling Scope Creep with DFDs 🛡️
Scope creep is the gradual expansion of requirements beyond the original agreement. DFDs act as a control mechanism. When a change is requested, the diagram is updated to visualize the impact.
Change Impact Analysis 📉
Any new requirement must be mapped onto the existing DFD. Ask these questions:
- Does this new feature require a new external entity?
- Does this change an existing process?
- Does this require a new data store?
- Does this add new data flows?
If the answer is yes, the scope has changed. The diagram makes this visible immediately. It prevents hidden costs. A stakeholder might say, “Just add a button.” The DFD might reveal that the button triggers a new data flow to an external system, requiring a new API contract.
Data Store Audits 🗄️
Changes often involve data. New requirements might need new storage. Auditing data stores helps control scope.
- Retention Policies: Does the new requirement change how long data is kept?
- Access Rights: Does the new requirement change who can see the data?
- Integration: Does the new data need to move to another system?
Every new data store adds maintenance overhead. Keeping the DFD clean ensures that only necessary stores are created.
Traceability and Consistency Checks 🔗
Maintain a traceability matrix linking requirements to DFD elements. This ensures every requirement has a place in the diagram.
- If a requirement exists without a DFD element, it is not being built.
- If a DFD element exists without a requirement, it might be gold-plating (doing extra work).
- Regular reviews compare the current DFD against the original scope baseline.
Integrating DFDs into Requirements Management 📝
DFDs are not just for designers; they are for analysts and project managers. Integrating them into the requirements process ensures consistency.
Traceability Matrix 📊
Link every requirement ID to a specific process or flow ID. This creates a direct line of sight. If a process is delayed, the linked requirements are flagged.
- Requirement ID: REQ-001
- Description: User must upload a profile photo.
- DFD Element: Process 2.1 (Upload Image)
- Status: In Progress
Consistency Checks ✅
Ensure that the DFD matches the system architecture. The diagram should not promise functionality that the architecture cannot support.
- Input/Output Balance: Ensure every process has at least one input and one output. A process that only stores data without output is often a dead end.
- Black Holes: Check for processes with no output. This indicates missing logic.
- Ghost Flows: Check for flows with no data. This indicates placeholder work.
Common Implementation Challenges ⚠️
Using DFDs for scope control is not always smooth. Teams often face specific hurdles.
Over-Engineering Flows 🏗️
It is tempting to draw every possible data path. This creates noise. Focus only on the primary flows that define the scope.
- Rule of Thumb: If a data flow does not affect the business value, do not include it in the scope diagram.
- Focus: Prioritize flows that cross the system boundary.
Ambiguous Labels 🏷️
Labels on processes and flows must be clear. Vague labels lead to vague scope.
- Bad Label: “Process Data”
- Good Label: “Validate and Store Customer Order”
Specific verbs help define the work. “Validate” is different from “Store”.
Static vs. Dynamic Views 🔄
DFDs are static. They show a snapshot. Scope changes over time. The diagram must be versioned. Use version control for the diagram files to track how scope evolves.
Metrics for Scope Health 📈
Quantitative measures help assess if the scope is manageable.
Complexity Ratios 📐
Calculate the ratio of data stores to processes. A high ratio might indicate excessive data management overhead.
- High Ratio: Many tables, few processes. Focus on data architecture.
- Low Ratio: Many processes, few tables. Focus on business logic.
Flow Density 📏
Count the number of data flows. High density means high integration effort.
- Threshold: If a Level 1 diagram has more than 10 flows, consider splitting it into sub-systems.
- Impact: More flows mean more testing points.
Finalizing the Scope Baseline 🏁
Once the DFDs are approved, they become the baseline. Any future work is measured against this baseline. The diagram is the contract between the business and the technical team.
- Sign-off: Require formal approval on the Context and Level 0 diagrams.
- Change Control: Any change to the diagram requires a formal change request.
- Documentation: Keep the diagram alongside the requirements document.
Visualizing scope is not just about drawing lines. It is about understanding the flow of value. By anchoring scope in Data Flow Diagrams, teams gain clarity, reduce risk, and deliver systems that match business needs.
Summary of Best Practices 🛠️
- Start with Context: Define the boundary before the details.
- Use Standard Symbols: Maintain consistency across the team.
- Review Regularly: Update diagrams as scope evolves.
- Validate Flows: Ensure every flow has a purpose.
- Track Changes: Version control all diagram artifacts.
Adopting this disciplined approach ensures that the project remains focused. The Data Flow Diagram becomes more than a technical artifact. It becomes the guide for the entire project lifecycle.