


In the landscape of system architecture and security engineering, visualizing data movement is not merely a design exercise; it is a fundamental security practice. A Data Flow Diagram (DFD) serves as a map for information traversing a system. When leveraged correctly for risk analysis, this map becomes a critical tool for identifying vulnerabilities before they manifest in production environments. This guide details the methodology for integrating risk identification and mitigation strategies directly into the DFD creation process.
Security is not an add-on feature; it is an inherent property of the design. By examining how data moves between external entities, processes, and data stores, architects can pinpoint where trust boundaries are crossed, where sensitive information is exposed, and where controls are missing. The following sections explore the mechanics of this approach, moving from foundational concepts to practical application.
🧩 Understanding the Core Elements of a Data Flow Diagram
Before analyzing risk, one must understand the components being analyzed. A DFD consists of four primary elements. Each element carries specific security implications that must be evaluated during the review process.
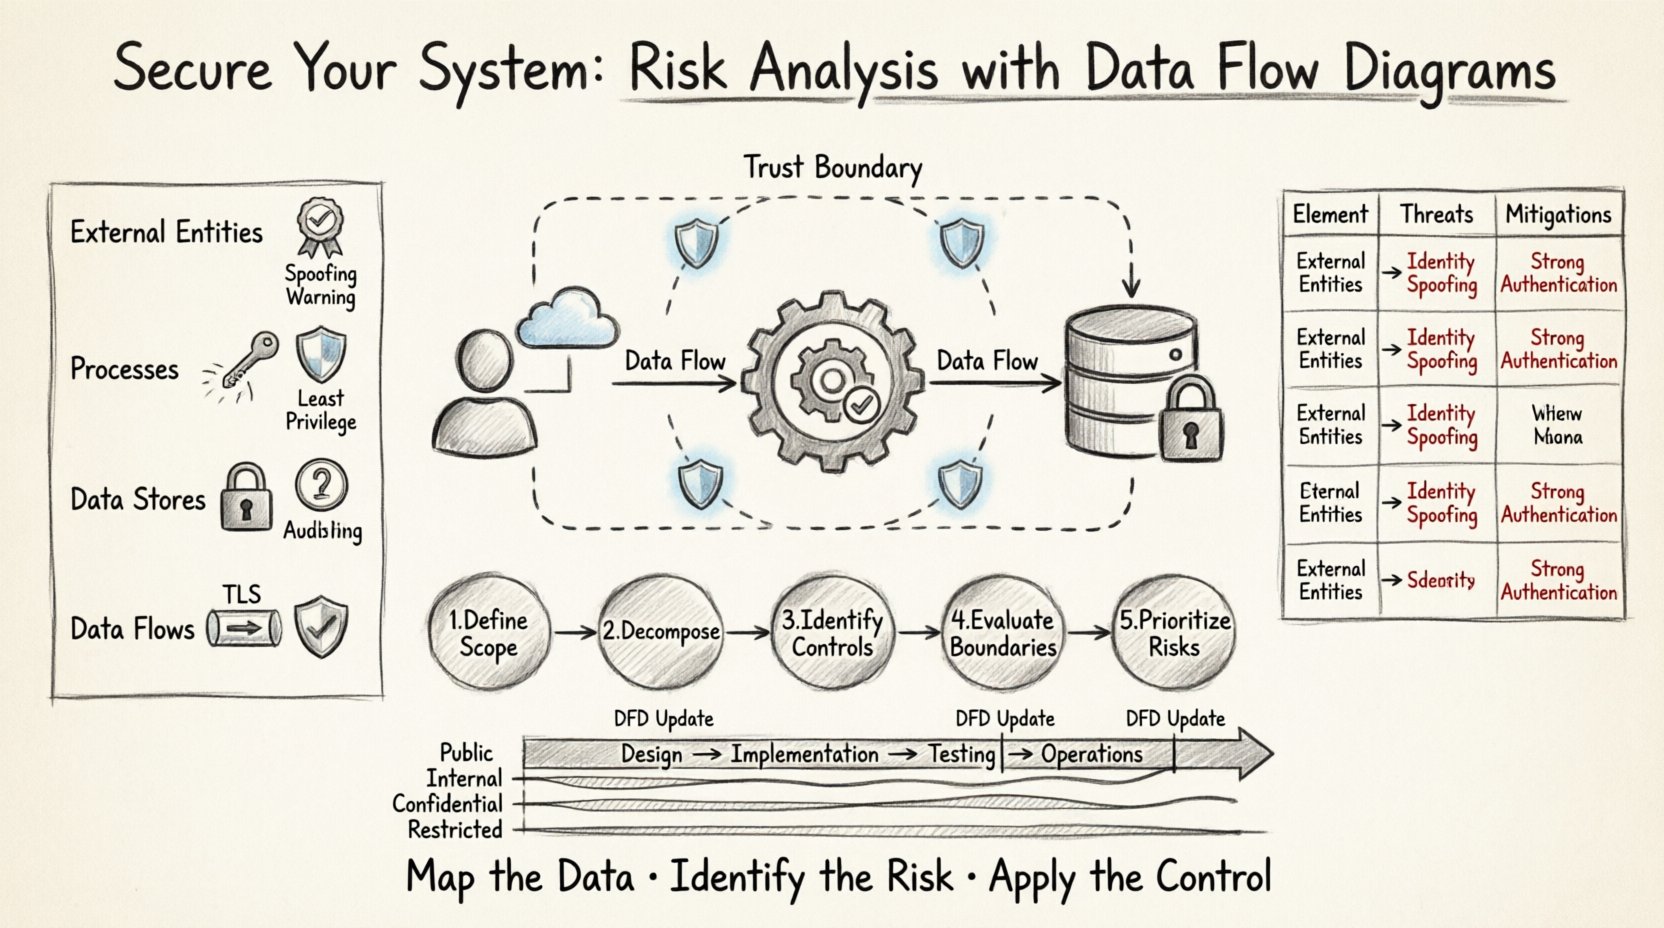
- External Entities: These represent sources or destinations of data outside the system boundaries. Examples include users, other systems, or third-party services. Security Implication: Entities are often the source of spoofing attacks or unauthorized access attempts. Every entity must be authenticated and authorized before interacting with internal processes.
- Processes: These are the functions or transformations that act on data. They change input data into output data. Security Implication: Processes are where logic errors occur. If a process fails to validate input, it may lead to injection attacks or logic bypasses. Ensuring the principle of least privilege applies to the execution context of each process is vital.
- Data Stores: These represent places where data is held at rest. They can be databases, files, or memory buffers. Security Implication: Data stores are the primary target for exfiltration. Access controls, encryption at rest, and integrity checks are mandatory here.
- Data Flows: These are the paths along which data moves between the other three elements. Security Implication: Flows represent the network or inter-process communication channels. Data in transit must be encrypted. Monitoring for unauthorized flows is essential for detecting lateral movement by attackers.
🔍 The Intersection of DFDs and Threat Modeling
Integrating risk analysis into DFDs requires a structured approach. This is often referred to as threat modeling using data flow diagrams. The goal is to identify potential threats associated with each element and flow, then determine appropriate mitigations.
When conducting this analysis, the focus shifts from “how does the system work?” to “how can the system be attacked?”. This shift in perspective allows teams to proactively design controls rather than reactively patching holes.
Key Objectives of DFD Risk Analysis
- Asset Identification: Determine which data elements are sensitive. Not all data requires the same level of protection.
- Trust Boundary Definition: Clearly mark where the system boundary ends and the external environment begins. Trust levels change across these boundaries.
- Threat Enumeration: List specific threats applicable to the diagram elements.
- Control Mapping: Assign security controls to specific diagram elements to mitigate identified threats.
📉 Analyzing Risks by DFD Level
Data Flow Diagrams are typically created in levels, moving from high-level context to detailed process logic. Each level offers a different granularity of risk insight.
Context Diagram (Level 0)
This is the highest level view. It shows the system as a single process interacting with external entities.
- Risk Focus: Network perimeter security and high-level access control.
- Analysis: Identify all external connections. Is there a direct internet connection? Are there legacy systems interfacing with the new design? High-level risks here include man-in-the-middle attacks on the primary communication channels.
Level 1 DFD
The main process is exploded into sub-processes. Data stores and flows become visible.
- Risk Focus: Internal data handling and process isolation.
- Analysis: Look for flows that bypass security checks. For example, does data flow from an untrusted entity directly to a sensitive data store without passing through a validation process? This level often reveals logic gaps in authentication flows.
Level 2 DFD (and beyond)
Sub-processes are further detailed. This level is often used for specific module analysis.
- Risk Focus: Data validation, encryption implementation, and error handling.
- Analysis: Examine specific algorithms or data transformations. Are cryptographic operations explicitly shown? Are error messages logged in a way that leaks information? This level is crucial for code-level security reviews.
📋 Risk Matrix: Mapping Elements to Threats
The table below summarizes common risks associated with specific DFD elements. This matrix serves as a checklist during the design review phase.
| DFD Element | Common Threats | Mitigation Strategies |
|---|---|---|
| External Entity |
|
|
| Process |
|
|
| Data Store |
|
|
| Data Flow |
|
|
🛠️ Step-by-Step Process for Risk Analysis
Implementing this analysis requires a disciplined workflow. The following steps outline the procedure for conducting a thorough risk review using DFDs.
Step 1: Define the Scope and Boundaries
Begin by drawing the context diagram. Clearly define what is inside the system and what is outside. This boundary is the trust perimeter. Any data crossing this line requires scrutiny. Document the trust level assigned to each external entity. Is the entity fully trusted, partially trusted, or untrusted?
Step 2: Decompose the System
Create Level 1 and Level 2 diagrams. As you decompose the main process, ensure every data flow is labeled with the type of data being transferred. For example, label a flow “Credit Card Number” rather than just “Payment Data.” Specificity allows for more precise risk categorization.
Step 3: Identify Security Controls
Review each diagram element against the risk matrix. Ask the following questions for every component:
- Does this component handle sensitive data?
- Is there an authentication mechanism in place?
- Is the data encrypted during transfer?
- Are there logs generated for audit purposes?
Step 4: Evaluate Trust Boundaries
Mark every trust boundary on the diagram. A trust boundary is where the level of trust changes. For example, a boundary exists between a public web server and an internal database. Crossing this boundary is the highest risk point. Ensure that every crossing point has a specific security control, such as a firewall rule, an API gateway, or an encryption tunnel.
Step 5: Document and Prioritize Risks
List every identified risk. Use a severity rating system (e.g., Low, Medium, High, Critical). Prioritize risks based on two factors: the likelihood of exploitation and the business impact if the risk is realized. High-impact risks should be addressed before deployment.
🚧 Common Pitfalls in DFD Security Analysis
Even experienced architects can overlook critical details. Being aware of common mistakes helps ensure a robust security posture.
- Ghost Flows: Ensure every data flow has a defined source and destination. Flows that start or end in nowhere often indicate missing logic or orphaned data processes. These gaps can be exploited by attackers.
- Ignoring Data at Rest: Focusing only on data in transit. Many breaches occur because data stored in databases is not encrypted or is accessible via overly permissive queries.
- Overlooking Authentication: Assuming that because a flow exists, it is secure. Data flows do not automatically imply security. Explicit authentication and authorization steps must be modeled as processes or controls.
- Lack of Version Control: DFDs evolve as the system changes. If the diagram does not match the current implementation, the risk analysis is invalid. Maintain versioning for your diagrams alongside code versions.
- Generic Labels: Using vague labels like “User Data” without specifying the data type. Specific data types trigger specific regulatory and security requirements (e.g., PII, PHI, PCI-DSS).
🔄 Integration into the Development Lifecycle
For DFD analysis to be effective, it cannot be a one-time event. It must be integrated into the software development lifecycle (SDLC).
Design Phase
During the initial design, create the context and Level 1 diagrams. Perform the high-level risk assessment. This ensures that fundamental security flaws are not baked into the architecture.
Implementation Phase
As developers build features, they should update the Level 2 diagrams. This keeps the security model current. Developers can use the diagram to verify that their code implements the necessary controls for data flows they are writing.
Testing Phase
Security testers can use the DFD to plan penetration tests. They can focus on the high-risk flows and trust boundaries identified in the analysis. This makes testing more efficient and targeted.
Operations Phase
Maintain the diagrams during operations. If a new third-party service is integrated, update the diagram. Review the risk analysis to ensure the new integration does not introduce new attack vectors.
📈 Measuring the Effectiveness of the Analysis
How do you know if the DFD risk analysis is working? Look for the following indicators of a mature security posture.
- Reduced Vulnerability Count: Fewer security findings during code reviews and penetration tests.
- Faster Remediation: When issues are found, they are easier to locate because the data flow is documented.
- Compliance Alignment: The diagrams map directly to compliance requirements (e.g., GDPR, HIPAA) by showing where sensitive data is processed and stored.
- Team Awareness: Developers and stakeholders understand the security implications of their design choices because the diagram visualizes the risks.
🛑 Handling Exceptions and Legacy Systems
Not all systems are greenfield. Many organizations must analyze legacy systems where documentation is missing or incomplete.
Reverse Engineering the DFD
If a diagram does not exist, you must create one from the code or configuration files. This process, known as reverse engineering, allows you to visualize the actual data flow rather than the intended one. Discrepancies between the actual flow and the intended design are often where risks hide.
Managing Technical Debt
Legacy systems may lack modern security features. When analyzing these systems, focus on compensating controls. If encryption cannot be implemented at the code level, can it be implemented at the network level? If authentication is weak, can an API gateway add a layer of security in front of the legacy application?
🔗 The Role of Data Classification
Risk identification is inextricably linked to data classification. You cannot protect what you do not understand. Data flows must be annotated with classification levels.
- Public: Information that can be shared openly. Low risk if exposed.
- Internal: Information for internal use only. Medium risk if exposed.
- Confidential: Sensitive business or personal information. High risk if exposed.
- Restricted: Highly sensitive data requiring strict access controls. Critical risk if exposed.
When analyzing a DFD, highlight flows containing Confidential or Restricted data in a distinct color. This visual cue immediately directs the security team’s attention to the most critical paths.
🧭 Conclusion on Methodology
Using Data Flow Diagrams for risk identification transforms security from a reactive checklist into a proactive design principle. By visualizing the movement of data, teams can see the invisible threats that lurk in the architecture. The process requires discipline, regular updates, and a clear understanding of the system components. When executed correctly, it provides a clear roadmap for securing the system against known and emerging threats.
The value of this approach lies in clarity. It forces architects to confront the reality of how data moves and where it is vulnerable. It removes ambiguity from the security discussion. As systems grow in complexity, the need for such structured analysis becomes even more critical. Maintaining accurate diagrams and rigorously applying risk analysis ensures that security remains aligned with business functionality throughout the entire lifecycle of the software.
Start with the diagram. Map the data. Identify the risk. Apply the control. This cycle creates a resilient system capable of withstanding the pressures of the modern threat landscape.