


Comparing complex datasets across multiple dimensions often ends in spreadsheet chaos. But Visual Paradigm’s AI Radar Chart Generator cuts through the noise. Describe your comparison in everyday language — flagship phones, team skill profiles, vendor capabilities — and get a clear, professional radar (spider) chart in moments. No manual axis setup, no tedious scaling, no frustration.
This smart tool turns raw specs into visual stories that highlight strengths, gaps, and trade-offs at a glance. Perfect for product managers, HR, competitive analysts, and anyone who needs multi-variable insights fast.
Why Radar Charts + AI = Instant Power
- Text prompt → full multi-axis radar chart instantly
- Auto-detects metrics, scales, and comparison entities
- Supports multiple series with distinct colors & polygons
- 100% editable native model for fine-tuning
- Seamless flow from quick chat to deep desktop refinement
1. Desktop: Prompt → Polished Comparison Chart
In Visual Paradigm Desktop:
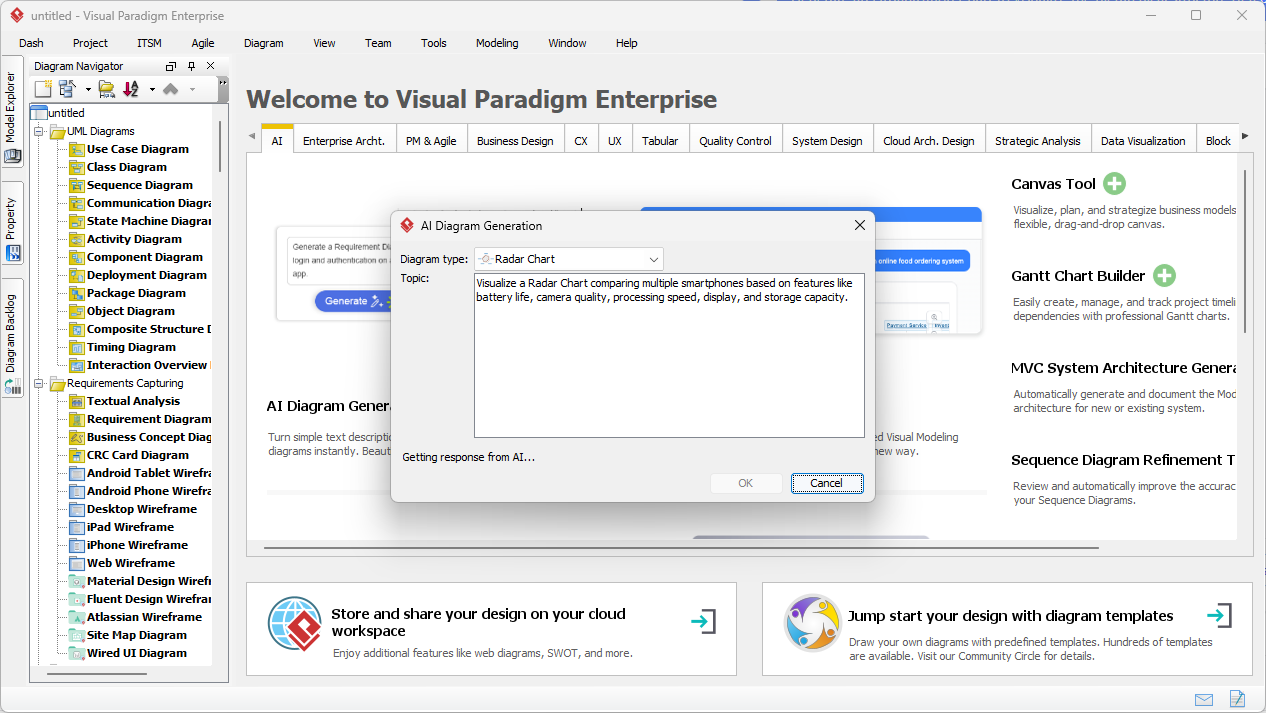
Tools → AI Diagram Generation → select “Radar Chart” → enter your comparison:
“Generate a radar chart comparing three flagship smartphones: iPhone 17 Pro, Galaxy S27 Ultra, Pixel 11 Pro across battery life, camera quality, processing speed, display, build quality, and price value.”
The prompt interface is clean and direct:
AI processes and delivers:
- 6 balanced axes with normalized scales
- Three overlapping polygons, each color-coded by device
- Instant visibility of winners (e.g., Galaxy in camera, iPhone in battery)
Here’s the generated smartphone comparison radar chart — sharp, readable, presentation-ready:
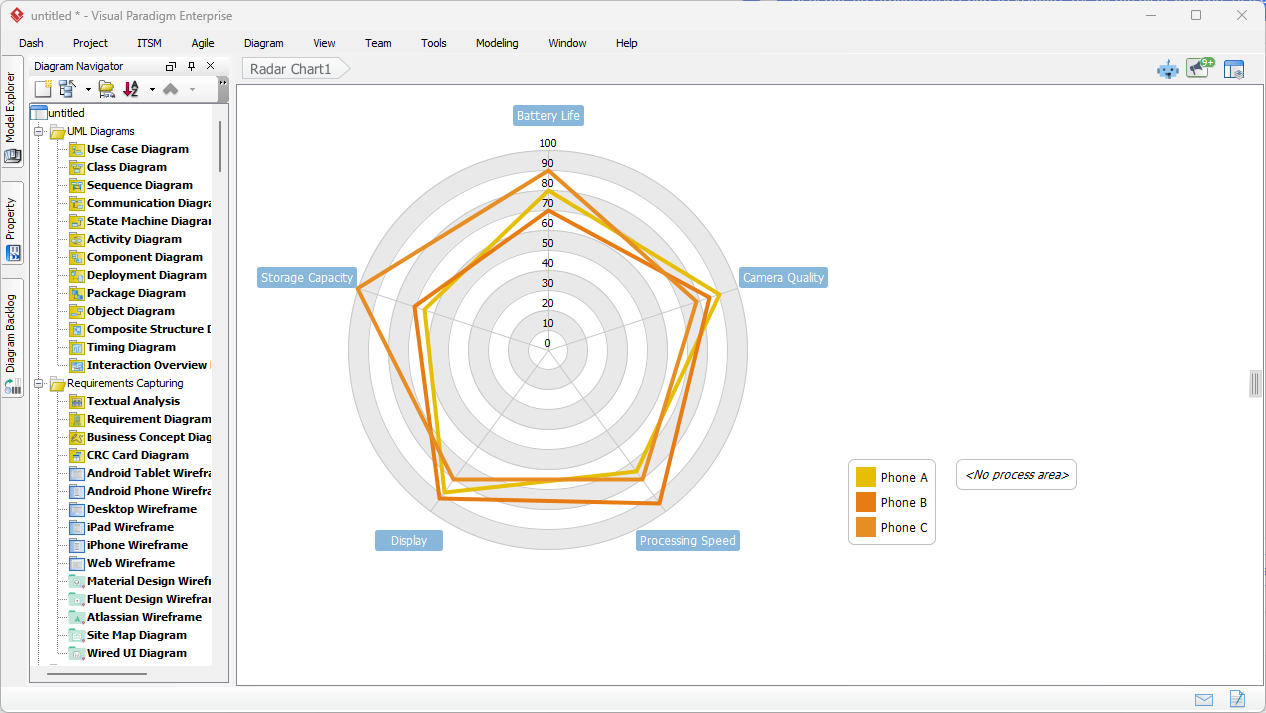
Customize colors, labels, add tooltips, or adjust values directly in the editor.
2. Chatbot: Conversational Insights on the Fly
For quick sessions or remote work, open the Visual Paradigm AI Chatbot:
“Create radar chart for team competency assessment: Developer A vs Developer B vs Developer C on coding speed, code quality, problem-solving, collaboration, learning agility, and technical depth.”
The chatbot builds it live — clear polygons show who excels where. Example output for team skills:
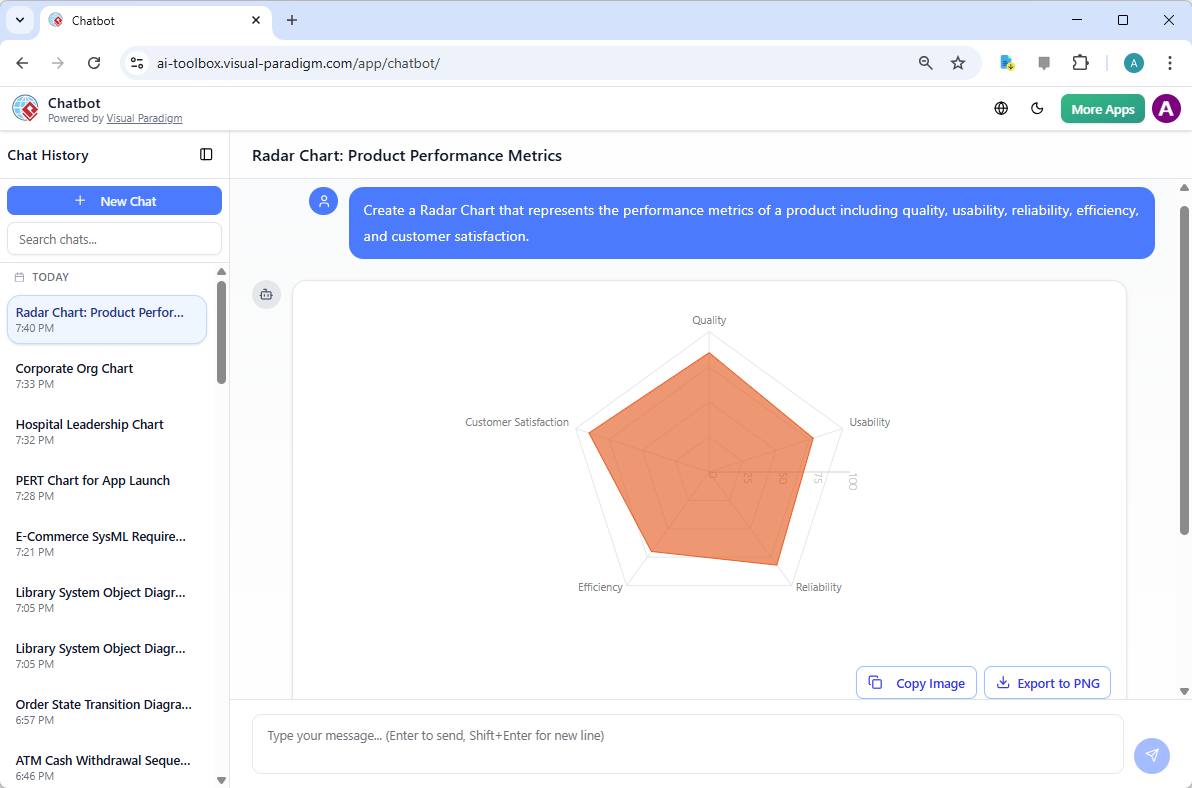
Refine instantly: “Change colors to company branding and add a fourth developer.” Update happens in real time. Great for 360 feedback, performance reviews, or live demos.
Real-World Wins with Radar Charts
Product teams spot feature gaps instantly. HR visualizes team strengths for training plans. Marketers show competitive positioning without tables. The overlapping shapes make patterns pop — something numbers alone rarely achieve.
Change a metric or add a competitor? Update the prompt or chat → regenerate → new insights in seconds. That speed keeps decisions moving.
Ready to See Your Data in a New Dimension?
Visual Paradigm’s AI Radar Chart Generator makes multi-dimensional analysis simple, visual, and fast — no design skills needed.
- Download Visual Paradigm Desktop → Full editing & integration: Get Desktop Now
- Try AI Chatbot Online → Instant radar charts anywhere: Start Chatting
Stop wrestling with spreadsheets. Start revealing insights — today.
Related Links
The integration of artificial intelligence into data visualization enables the automated generation of radar charts to represent multidimensional performance and capability metrics. These resources describe how intelligent automation and interactive tools help teams conduct competitive analysis, identify patterns in complex data, and support strategic decision-making. By leveraging pre-built templates and specialized tutorials, users can efficiently create professional charts for business intelligence and market research.
- AI Diagram Generator Adds Radar Chart Support: The AI Diagram Generator has been updated to include support for radar charts, allowing for the visualization of complex performance and capability metrics.
- AI-Powered Radar Chart Creation in Visual Paradigm Desktop: This tutorial teaches users how to generate intelligent, data-driven radar charts using AI features within the Visual Paradigm Desktop environment.
- How to Use Radar Charts for Competitive Analysis: Radar charts can be used to perform competitive analysis by comparing various competitors across key performance metrics.
- Comprehensive Tutorial: Creating Radar Charts with Visual Paradigm Online: This comprehensive guide provides step-by-step instructions for creating professional radar charts using online diagramming tools.
- Unlocking Insights: The Power of Radar Charts for Data Visualization: Radar charts are powerful tools for data visualization because they uncover patterns in multidimensional data and enhance information clarity.
- Radar Chart Tool – Visual Paradigm Features: Visual Paradigm offers a customizable and interactive radar chart tool suitable for both business and technical analysis.
- Radar Chart for Competitor Analysis: A Data Visualization Guide: This data visualization guide explains how to use radar charts to support strategic planning and market positioning through competitor comparisons.
- Radar Chart Templates – Visual Paradigm Online: A variety of ready-to-use templates are available to help users quickly visualize performance, capabilities, and comparative data.
- Interactive Radar Chart Maker Tool: The online radar chart maker provides an interactive platform for creating and customizing charts with real-time visualization features.
- Create a Radar Chart Using Open API: This technical guide demonstrates how to programmatically generate radar charts for data flows using an Open API.