


In the landscape of systems engineering and software development, the gap between what is requested and what is delivered often stems from ambiguous communication. Data Flow Diagrams (DFDs) serve as a visual bridge between abstract requirements and concrete implementation logic. Validating system requirements through structured walkthroughs ensures that every data movement, transformation, and storage requirement is accounted for before coding begins. This process reduces rework and aligns technical execution with business intent.
This guide explores the methodology of using DFD walkthroughs to validate requirements. It covers the foundational elements of data modeling, the procedural steps for conducting a validation session, and the metrics used to determine success. By focusing on the flow of information rather than just functional features, teams can identify logical gaps that traditional text-based requirements often miss.
🧩 Understanding the Core Components of DFDs
Before initiating a validation walkthrough, it is essential to understand the notation and semantics used in Data Flow Diagrams. A DFD is not a flowchart of control logic or a database schema; it is a representation of how data moves through a system. Clarity in this definition prevents confusion during the validation phase.
The following elements form the backbone of any DFD used for requirements validation:
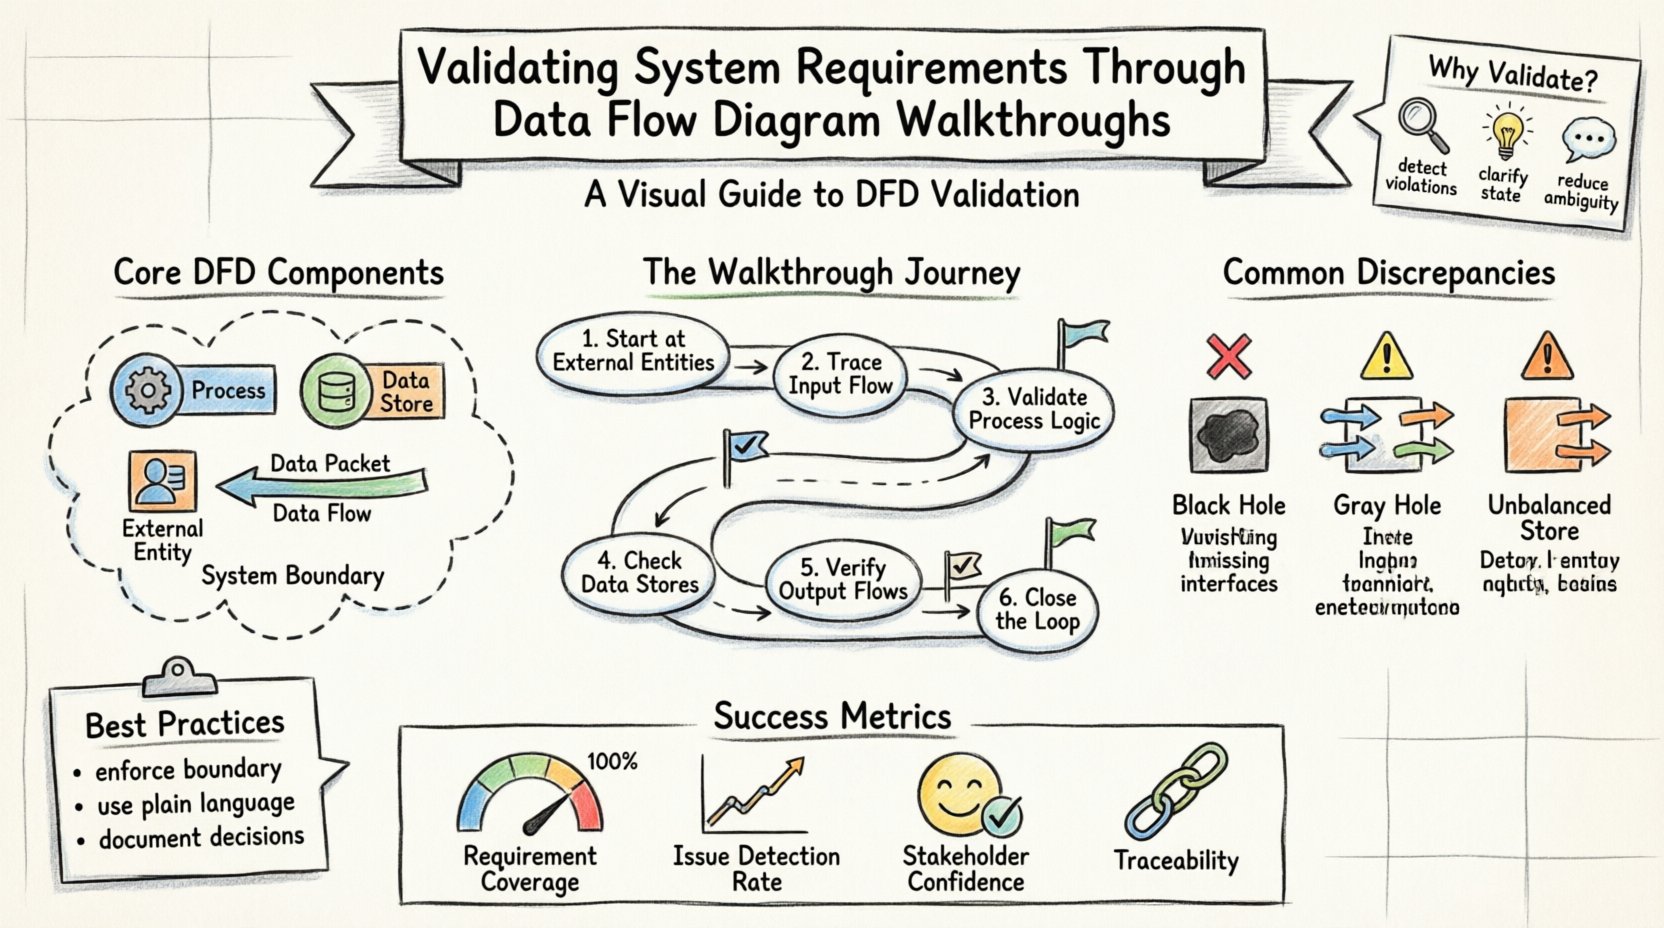
- Processes: Represented by rounded rectangles or circles, these are activities that transform input data into output data. Each process must have at least one input and one output. In a validation context, each process corresponds to a specific business rule or calculation defined in the requirements.
- Data Stores: Represented by open-ended rectangles, these indicate where data is held for later retrieval. They correspond to database tables, files, or caches. Validating these ensures that persistence requirements are met.
- External Entities: Represented by squares or icons, these are sources or destinations of data outside the system boundary. Examples include users, external APIs, or regulatory bodies. Validating these ensures correct interface definitions.
- Data Flows: Represented by arrows, these show the movement of data between entities, processes, and stores. Every arrow must be labeled with the specific data being transmitted. This is the most critical area for validation.
- System Boundary: A conceptual line separating the system from the external world. Everything inside is part of the system; everything outside is an external entity.
When reviewing a DFD, the focus is on the integrity of these components. If a data flow enters a process but no data leaves, the process is incomplete. If a data store is accessed without a defined flow, it suggests a missing requirement. The walkthrough aims to catch these structural issues.
🛡️ The Critical Role of Requirements Validation
Requirements validation is the process of confirming that the documented requirements accurately reflect the needs of the stakeholders and are feasible to implement. While functional specifications describe what the system does, DFDs describe how data behaves. Combining these two views provides a holistic check.
Why is this validation step non-negotiable?
- Detecting Data Conservation Violations: The principle of data conservation states that all inputs to a process must result in outputs, and no data can be created or destroyed arbitrarily. A walkthrough reveals where data disappears or appears without a source, indicating a logical error in the requirements.
- Identifying Missing Interfaces: Text requirements might mention “sending a report,” but a DFD forces the team to define the exact payload. If the diagram shows a flow to a report generator but the requirements lack details on the report format, the gap is visible.
- Clarifying State Changes: DFDs do not show state, but they imply it through data stores. Validating the diagram ensures that the triggers for state changes are properly identified in the requirements.
- Reducing Ambiguity: Visual models reduce interpretation variance. When stakeholders point to a specific arrow on a diagram, there is less room for misinterpretation than when reading a paragraph of text.
Skipping this step often leads to the “gold-plating” phenomenon, where developers implement features that were not needed, or worse, fail to implement critical data transformations because the logic was never modeled.
📋 Preparing for a Successful Walkthrough
Conducting a walkthrough is a disciplined activity that requires preparation. Rushing into a session without a clear agenda often results in digressions and unresolved issues. The preparation phase sets the stage for a productive validation effort.
1. Assemble the Right Participants
The walkthrough team should include:
- Business Analysts: To explain the business rules and requirements.
- System Architects: To ensure technical feasibility of the flows.
- Stakeholders: To confirm that the model matches their mental model of the system.
- Developers: To provide insight into implementation constraints.
2. Define the Scope
Do not attempt to validate the entire system at once. Break the DFD into logical levels. Start with the Context Diagram (Level 0), which shows the system as a single process interacting with external entities. Then move to Level 1, which decomposes the main process into sub-processes. This hierarchical approach prevents cognitive overload.
3. Establish the Baseline
Ensure the requirements document is versioned and agreed upon. The DFD must be traceable back to specific requirement IDs. Create a traceability matrix that links each data flow to a requirement statement. During the walkthrough, if a flow cannot be traced, it is flagged as an orphan.
4. Distribute Pre-Read Materials
Send the diagrams and requirement documents at least 24 hours before the session. This allows participants to review the content and prepare questions. Time spent in the meeting should be for discussion and resolution, not for reading.
🚶 Conducting the Walkthrough Step-by-Step
The execution of the walkthrough follows a structured path. The facilitator guides the group through the diagram, tracing every path from source to destination. This process is often called “tracing the flow.”
- Start at the External Entities: Identify the source of data. Ask: “Where does this data come from?” Verify that the source is defined in the requirements. Check the data type and frequency.
- Trace the Input Flow: Follow the arrow entering the first process. Ask: “What happens to this data?” Does it get stored? Does it get transformed? Does it pass through to another process?
- Validate Process Logic: For each process box, review the transformation rules. Ensure that the output data matches the expected result of the input data based on the business rules. Check for completeness: are all required inputs present?
- Check Data Stores: When a flow enters a data store, verify the storage requirement. Does the system need to retain this data permanently? Is there a retention policy? Is there a retrieval flow defined for later use?
- Verify Output Flows: Follow the arrows leaving the system. Do they match the requirements for reporting, notifications, or API responses? Ensure that sensitive data is not flowing to unauthorized external entities.
- Close the Loop: Ensure that all data generated within the system has a defined destination. Orphaned outputs indicate a design flaw.
During this process, use a whiteboard or digital canvas to annotate the diagram. Mark areas of uncertainty with a specific color. Do not try to resolve every issue immediately; record them in an action log for later resolution.
🕵️♂️ Identifying Common Discrepancies
Experience shows that certain types of errors recur in system models. Recognizing these patterns accelerates the validation process. The table below outlines common issues found during DFD walkthroughs and their typical causes.
| Discrepancy Type | Description | Validation Impact |
|---|---|---|
| Black Hole | A process has inputs but no outputs. | Data is consumed without result. Indicates missing logic or failed requirement. |
| Gray Hole | A process has inputs and outputs, but the output does not logically follow from the input. | Implies hidden logic not captured in requirements. High risk of implementation error. |
| Child Process Violation | Lower-level diagrams show flows not present in the parent diagram. | Decomposition error. Scope creep or missing parent requirements. |
| Unbalanced Data Store | Data enters a store but never leaves, or vice versa, without justification. | Suggests orphaned data or missing retrieval requirements. |
| External Entity Loop | Data flows from Entity A to System to Entity B, which then flows back to Entity A directly. | May indicate a bypass of the system or a misunderstanding of the boundary. |
Addressing these discrepancies during the walkthrough prevents them from becoming bugs in the production system. Each identified issue should be logged with a severity rating and assigned to an owner for resolution.
📈 Measuring Validation Effectiveness
How do you know the walkthrough was successful? Relying on a subjective “feeling” is insufficient. Use quantitative and qualitative metrics to assess the quality of the validation.
- Requirement Coverage: Calculate the percentage of requirements that have a corresponding visual element in the DFD. A target of 100% coverage for critical flows is standard.
- Issue Detection Rate: Track the number of defects found during the walkthrough versus those found during testing. A high detection rate during requirements validation indicates a robust review process.
- Traceability Completeness: Measure the percentage of data flows that have a direct link to a requirement ID. Flows without links are candidates for deletion or further definition.
- Stakeholder Confidence: After the walkthrough, conduct a brief survey. Do stakeholders feel the model accurately represents their needs? Their confidence is a leading indicator of project success.
- Change Request Volume: Monitor the number of change requests generated after the design phase begins. A well-validated DFD should result in fewer mid-project requirement changes.
🔄 Maintaining Alignment Over Time
A DFD is not a static artifact. As the system evolves, requirements change, and the diagram must evolve with them. The validation process should not be a one-time event but a recurring activity.
Version Control
Every change to the DFD must be versioned. If a new data flow is added, the version number should increment, and the change log should detail the reason. This maintains a history of how requirements shifted over time.
Integration with Agile Cycles
In iterative development, DFDs can be updated at the start of each sprint or release. Use the walkthrough as a gatekeeping mechanism. No code for a new feature should begin until the relevant portion of the DFD is validated against the sprint backlog.
Automation and Tooling
While manual walkthroughs are effective, using modeling tools that enforce syntax rules can catch errors before the human review. Tools can automatically check for black holes or unbalanced processes. However, human judgment remains essential for validating business logic.
Training and Knowledge Transfer
New team members should be trained on the existing DFDs. This ensures that they understand the data context before writing code. The diagram serves as the source of truth for data architecture, complementing the codebase.
🛠️ Best Practices for Facilitators
The success of the walkthrough often depends on the facilitator. A skilled facilitator keeps the group focused and ensures that all voices are heard. Here are specific practices to adopt:
- Enforce the Boundary: If the discussion drifts to technical implementation details (e.g., “Should we use SQL or NoSQL?”), defer it. Focus on the data flow. Implementation details can be discussed separately.
- Encourage Silence: After asking a question, wait. Often, the most critical insight comes after a moment of silence when someone realizes they missed a detail.
- Use Plain Language: Avoid jargon when describing the diagram. Use terms that business stakeholders understand. If a term is necessary, define it immediately.
- Document Decisions: Every decision made during the walkthrough must be recorded. If a requirement is deemed unnecessary, document that decision with the rationale. This prevents arguments later.
- Manage Conflict: Disagreements about data ownership or flow direction are common. Focus on the data itself, not the departments. Ask, “What is the data?” rather than “Who owns this?”
🔗 Integrating with Other Modeling Techniques
DFDs do not exist in isolation. They work best when integrated with other modeling techniques to provide a complete picture of the system.
- Entity Relationship Diagrams (ERD): While DFDs show movement, ERDs show structure. Cross-reference the data stores in the DFD with the tables in the ERD to ensure consistency.
- State Transition Diagrams: DFDs do not show state. Use state diagrams to define the lifecycle of data objects (e.g., an order moving from “Pending” to “Shipped”). Combine these views for a full specification.
- Use Case Diagrams: Use cases describe interactions from a user perspective. Map use cases to the processes in the DFD to ensure every user action triggers a data transformation.
This multi-view approach reduces the risk of blind spots. For instance, a use case might specify a user action, the DFD shows the data path, and the ERD confirms the storage integrity. Together, they form a robust validation framework.
🏁 Conclusion
Validating system requirements through Data Flow Diagram walkthroughs is a rigorous but necessary discipline. It transforms abstract text into visual logic, exposing gaps that would otherwise remain hidden until costly testing phases. By adhering to the principles of data conservation, maintaining traceability, and conducting structured reviews, organizations can significantly improve the quality of their systems.
The effort invested in these walkthroughs pays dividends in reduced rework, clearer communication, and higher stakeholder confidence. It is not merely a documentation exercise; it is a fundamental quality assurance activity that ensures the system being built actually solves the problem it was intended to address.