


Creating accurate data flow diagrams is a cornerstone of robust system analysis. When project delivery approaches the handover phase, the integrity of these diagrams determines the clarity of the final system. A well-constructed DFD serves as a blueprint for developers, a communication tool for stakeholders, and a validation artifact for testers. Without rigorous review checkpoints, ambiguity can slip into the development cycle, leading to costly rework. This guide outlines the essential verification steps required to ensure your Data Flow Diagrams meet professional standards.
This document focuses on the technical validation of DFDs. It covers structural integrity, logical consistency, and alignment with business requirements. By following these checkpoints, teams can ensure that the flow of information remains accurate from input to output, regardless of the underlying technology stack.
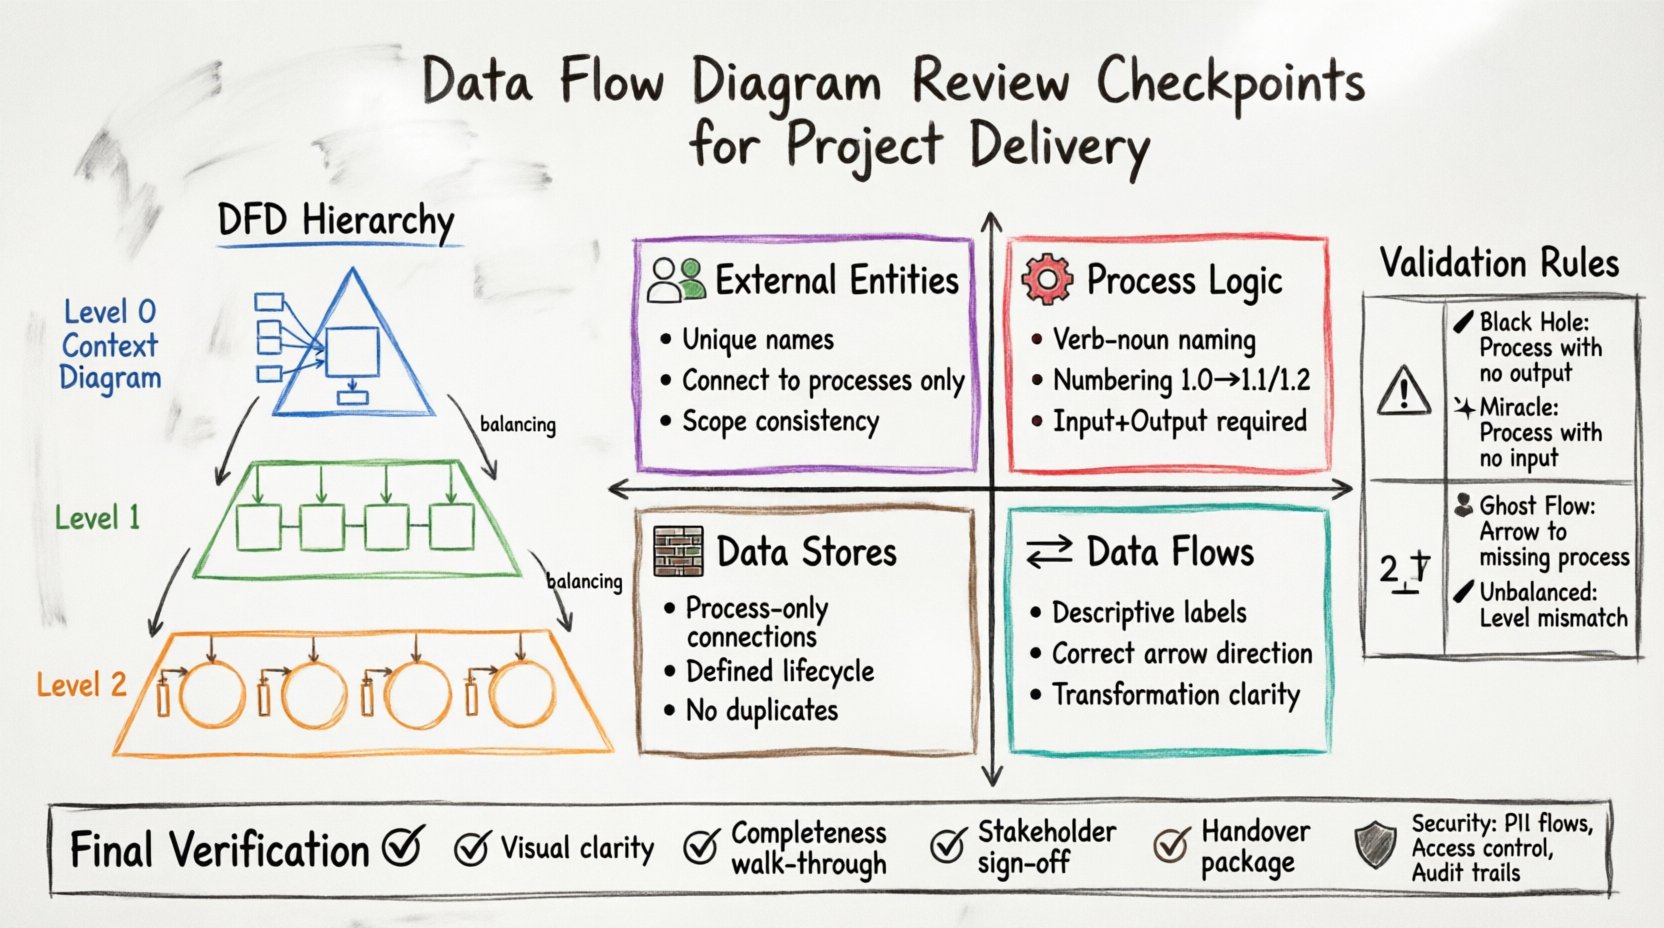
Understanding the DFD Hierarchy 📚
Before beginning a review, it is vital to understand the levels of abstraction used within the diagramming process. A single document rarely captures the entire system. Instead, a hierarchy of diagrams is typically employed.
Context Diagram (Level 0): This provides a high-level view of the system boundary. It shows the system as a single process interacting with external entities. It defines the scope.
Level 1 Diagram: This decomposes the single process into major sub-processes. It details the primary data movements between these functions.
Level 2 Diagram: This further breaks down specific Level 1 processes. It offers granular detail on data handling logic.
Each level must maintain consistency with the level above it. This concept, known as balancing, ensures that inputs and outputs do not change arbitrarily as you drill down into detail.
Core Review Checkpoints 🔍
A successful review relies on a structured checklist. The following areas require close attention to ensure the diagram accurately reflects the system design.
1. External Entity Verification 👥
External entities represent sources or destinations of data outside the system boundary. They are not part of the system itself but interact with it.
Identification: Ensure every external entity has a clear, unique name. Avoid generic labels like “User” without specification. Use specific roles like “Registered Customer” or “Billing System”.
Connectivity: Verify that entities only connect to processes, never directly to other entities or data stores. This maintains the structural rules of the notation.
Scope: Confirm that the entities listed in the Context Diagram match those in the Level 1 diagram. If a new entity appears in Level 1 that was absent in the Context Diagram, the scope has shifted.
2. Process Logic and Numbering ⚙️
Processes transform data. They are the active components of the diagram.
Naming Convention: Names must follow a verb-noun structure. Examples include “Calculate Tax” or “Generate Report”. Avoid noun-only names like “Tax Calculation”, which describes a state rather than an action.
Numbering: Maintain a strict numbering scheme. If a process is labeled 1.0, its child processes must be 1.1, 1.2, etc. This aids in cross-referencing documentation.
Completeness: Every process must have at least one input and one output. A process with no output is a dead end, while a process with no input is a source, which should typically be an external entity.
3. Data Flow Directionality 🔄
Data flows represent the movement of information. They are the arrows connecting the components.
Labels: Every flow must have a descriptive label indicating the content. Instead of “Data”, use “Order Details” or “Payment Confirmation”.
Direction: Ensure arrows point in the correct direction. Data should flow from the source to the destination. A bidirectional arrow is generally avoided unless explicitly representing a query-response pair.
Consistency: The data label on an input to a process must match the data label on an output from that same process if no transformation occurs. If transformation happens, the label should reflect the change (e.g., “Raw Order” in, “Processed Order” out).
4. Data Store Management 🗃️
Data stores are repositories where information rests. They are passive components.
Read/Write Access: A data store should only be connected to a process. It should not connect directly to an external entity. If data moves from an entity to a store, it must go through a process that handles the logic.
Storage Logic: Ensure that every data store has a defined lifecycle. Is it temporary or permanent? Does it require archiving? The diagram should reflect the flow of data into and out of storage.
Uniqueness: Data stores should not be duplicated unnecessarily. If two processes access the same information, they should reference the same store entity.
Validation Rules and Balancing ⚖️
Validation ensures the logical consistency across the diagram hierarchy. This is often the most critical phase of the review.
Conservation of Flow
The total input and output flows must be conserved across levels. If a Level 0 diagram shows an input of “Customer Request”, that input must appear in the Level 1 diagram as an input to the corresponding sub-process. You cannot create or destroy data flows during decomposition.
Balancing Check
This rule dictates that the inputs and outputs of a parent process must match the combined inputs and outputs of its child processes. If a Level 1 process produces “Invoice”, the Level 2 processes that make up that Level 1 process must collectively produce “Invoice”.
Rule | Description | Violation Example |
|---|---|---|
Black Hole | A process with no output. | A process receives data but does not send it anywhere. |
Miracle | A process with no input. | A process generates data without receiving any trigger or information. |
Ghost Flow | A flow connecting to a process that does not exist. | An arrow points to a process that was deleted or renamed. |
Unbalanced Flow | Inputs/Outputs do not match between levels. | Level 1 shows an output that Level 0 does not account for. |
Common Diagrammatic Errors ⚠️
Experienced analysts often spot recurring mistakes. Being aware of these pitfalls helps streamline the review process.
Control Flows vs. Data Flows: Confusing the flow of data with the flow of control. A DFD tracks data, not control signals. If a signal triggers a process but no data moves, it should not be represented as a data flow.
Over-Engineering: Including too much detail in a high-level diagram. Level 0 and Level 1 should focus on major functions. Detailed logic belongs in Level 2 or in separate logic specifications.
Database Confusion: Treating a database table as a process. A table is a store. A query is a process. Do not draw a database icon as a circle representing a function.
Looping: While loops are common in code, DFDs generally represent linear flows. If a process feeds back into itself, ensure it is a distinct data store interaction, not a direct flow loop.
Stakeholder Alignment 🤝
A diagram is not just a technical artifact; it is a communication tool. The review must include validation against stakeholder understanding.
Business Terminology: Ensure the labels used in the diagram match the terminology used by business users. If the business calls it “Client” and the diagram uses “User”, confusion will arise.
Workflow Reality: Does the diagram reflect how work is actually done? Sometimes business processes are informal, while the diagram is formal. The review should identify gaps between the ideal process and the documented process.
Sign-off Criteria: Define what constitutes acceptance. Is it sufficient for the business to say “Yes”? Or does the technical team need to verify that the logic is implementable?
Integration with Requirements 🧩
The DFD must align with the functional requirements document. A disconnect here suggests a gap in the analysis.
Traceability: Each process in the DFD should map to a specific requirement. If a process has no corresponding requirement, it may be scope creep. If a requirement has no corresponding process, it may be an oversight.
Data Dictionary Consistency: The data elements flowing through the diagram should match the definitions in the data dictionary. Check field lengths, types, and mandatory fields.
Non-Functional Requirements: While DFDs are primarily functional, performance and security requirements can be noted. For instance, a flow containing sensitive data might require encryption, which is a constraint on the flow itself.
Security and Compliance Considerations 🛡️
In modern project delivery, security is not an afterthought. It must be visible in the data flow.
Data Sensitivity: Identify flows that contain Personally Identifiable Information (PII) or financial data. These flows should be marked or annotated to ensure security protocols are applied during implementation.
Access Control: Determine which external entities are authorized to access specific data stores. While DFDs do not typically show permissions explicitly, the connections imply access. Ensure no unauthorized entities connect to sensitive stores.
Audit Trails: Flows that involve data modification should ideally indicate where logs are generated. The diagram should show where audit data is sent to a separate store.
Documentation and Version Control 📝
The review process generates documentation. This must be managed effectively.
Versioning: Every revision of the diagram must be versioned. Changes should be tracked. If a flow is removed, the reason should be documented. This prevents confusion during the development phase.
Change Log: Maintain a log of all review findings. Record who raised the issue, the severity, and the resolution status. This provides an audit trail for the project delivery.
Metadata: Include metadata on the diagram itself. This includes the author, the review date, the version number, and the status (Draft, Under Review, Approved).
Final Verification Steps ✅
Before the project moves to the next phase, perform a final sweep of the artifacts.
Visual Clarity: Is the diagram easy to read? Avoid crossing lines where possible. Use orthogonality (right angles) for lines to improve readability. Group related processes together.
Completeness Check: Walk through the diagram from start to finish. Ensure every external entity has a path to the data store and back to an output. There should be no dead ends.
Stakeholder Walkthrough: Conduct a final walkthrough with key stakeholders. Verify that the diagram tells the correct story of the system behavior.
Handover Package: Compile the diagrams, the review checklist, and the requirements traceability matrix into a single package for the development team.
Impact of Poor Diagram Quality 📉
Skipping these checkpoints carries significant risk. Inaccurate DFDs lead to:
Development Delays: Developers spend time clarifying logic that should have been clear.
Budget Overruns: Rework required to fix logic errors discovered late in the cycle.
System Gaps: Features that were assumed but not documented fail to be built.
Maintenance Nightmares: Future teams cannot understand the system because the diagram does not match the code.
Conclusion on Review Discipline 📋
Executing a thorough review of Data Flow Diagrams is a discipline that pays dividends throughout the project lifecycle. It requires attention to detail, adherence to notation standards, and constant communication with stakeholders. By following the checkpoints outlined in this guide, teams can ensure that the system architecture is sound, the data flows are logical, and the project delivery remains on track. Accuracy in the analysis phase reduces uncertainty in the construction phase.
Remember that a diagram is a living document. As requirements evolve, the DFD must evolve with it. Regular reviews should be scheduled, not just performed at the end of the analysis phase. This continuous validation keeps the project aligned with business goals.
Commit to these standards. They form the backbone of reliable system analysis and successful project delivery.