


Transform your ideas into stunning visuals in seconds—no design experience required
Introduction: Why AI-Powered Infographics Matter in 2026
In today’s fast-paced digital landscape, visual communication isn’t just helpful—it’s essential. Whether you’re a marketer crafting social media content, an educator developing engaging lessons, or a business professional preparing executive reports, the ability to present complex information clearly and attractively can make all the difference.
But let’s be honest: creating professional infographics traditionally required design skills, hours of tedious formatting, and expensive software. That’s where Visual Paradigm’s AI Infographic Generator changes the game. By combining intelligent content generation with flexible, professional templates, this tool empowers anyone to produce publication-ready visuals in minutes—not hours.

This comprehensive guide walks you through every feature, workflow, and best practice to help you master the platform and create infographics that captivate your audience.
Getting Started: The Three-Step Creation Workflow
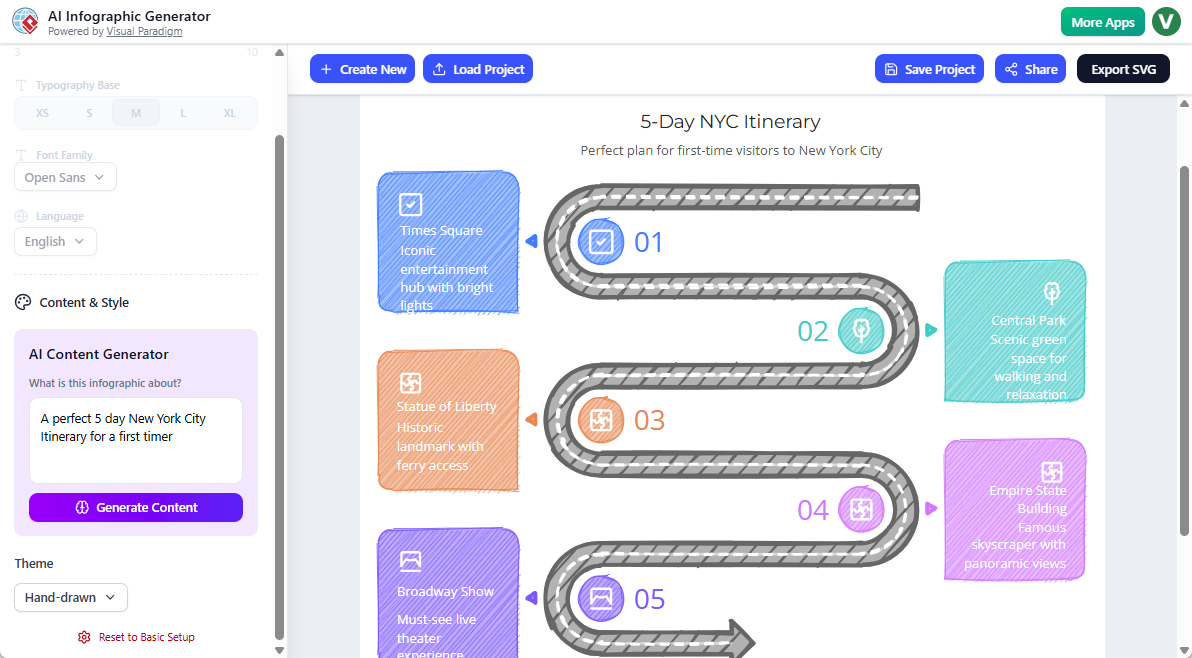
Visual Paradigm has streamlined infographic creation into an intuitive, three-step process that eliminates guesswork and accelerates your workflow.
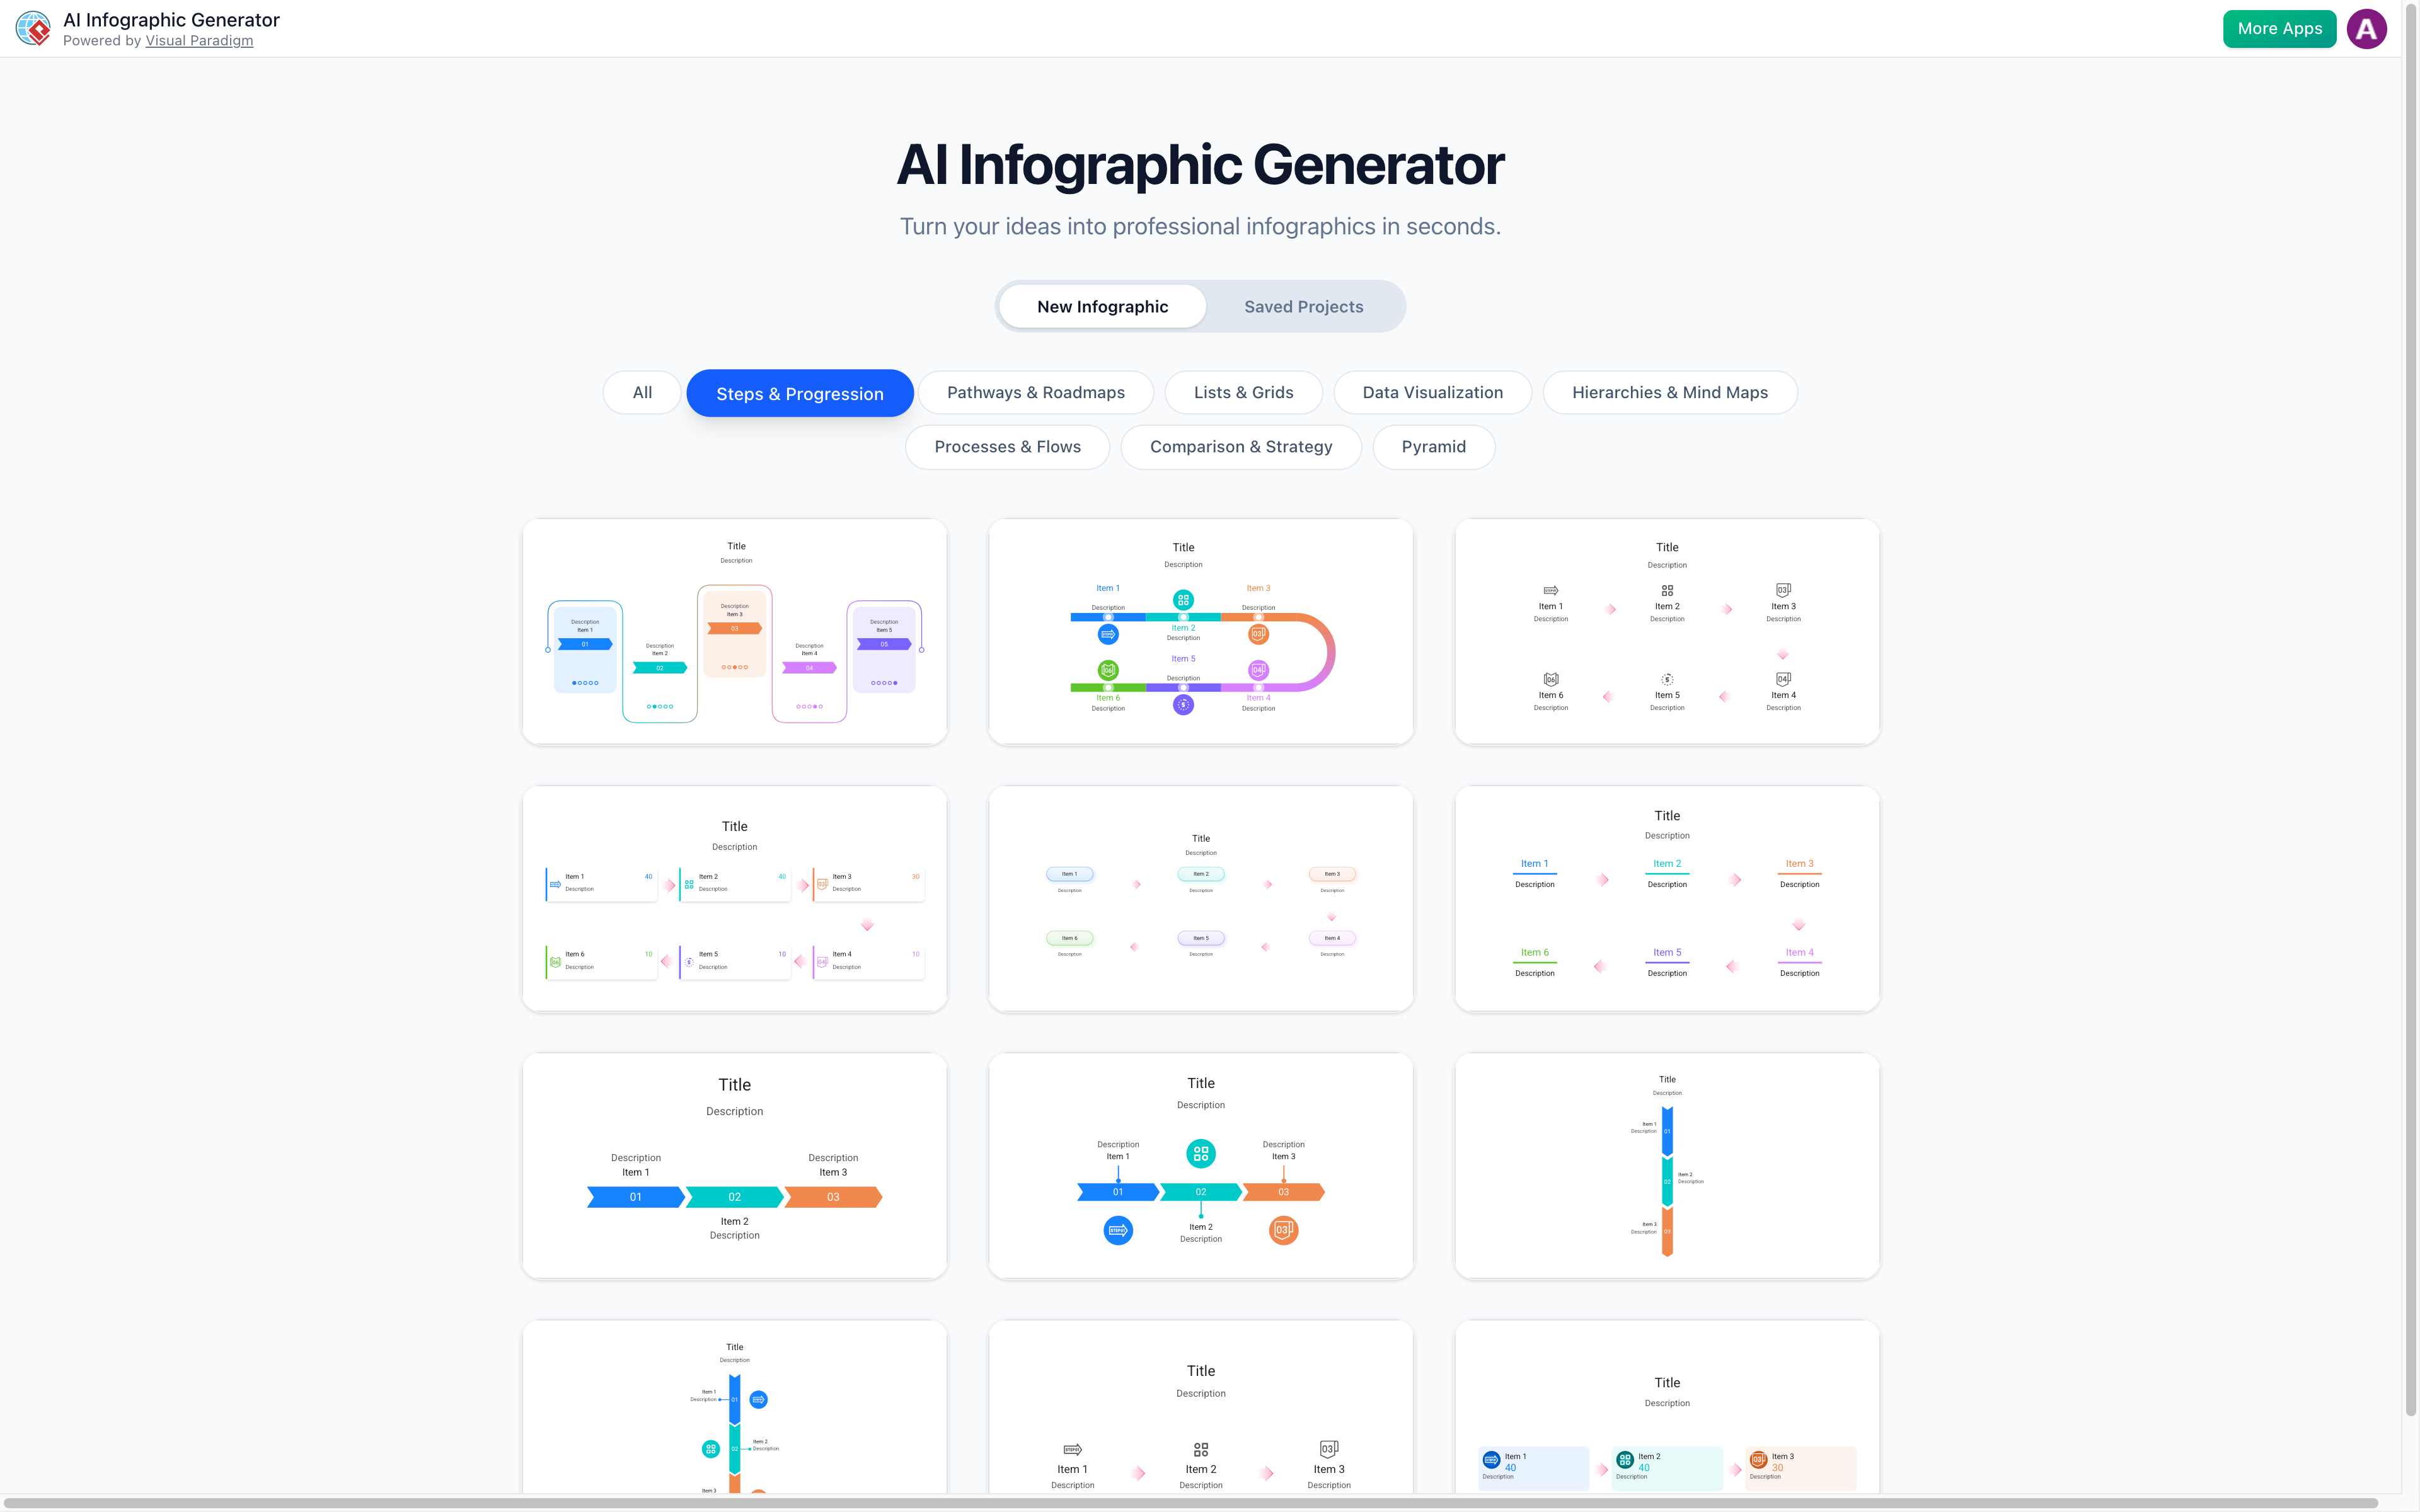
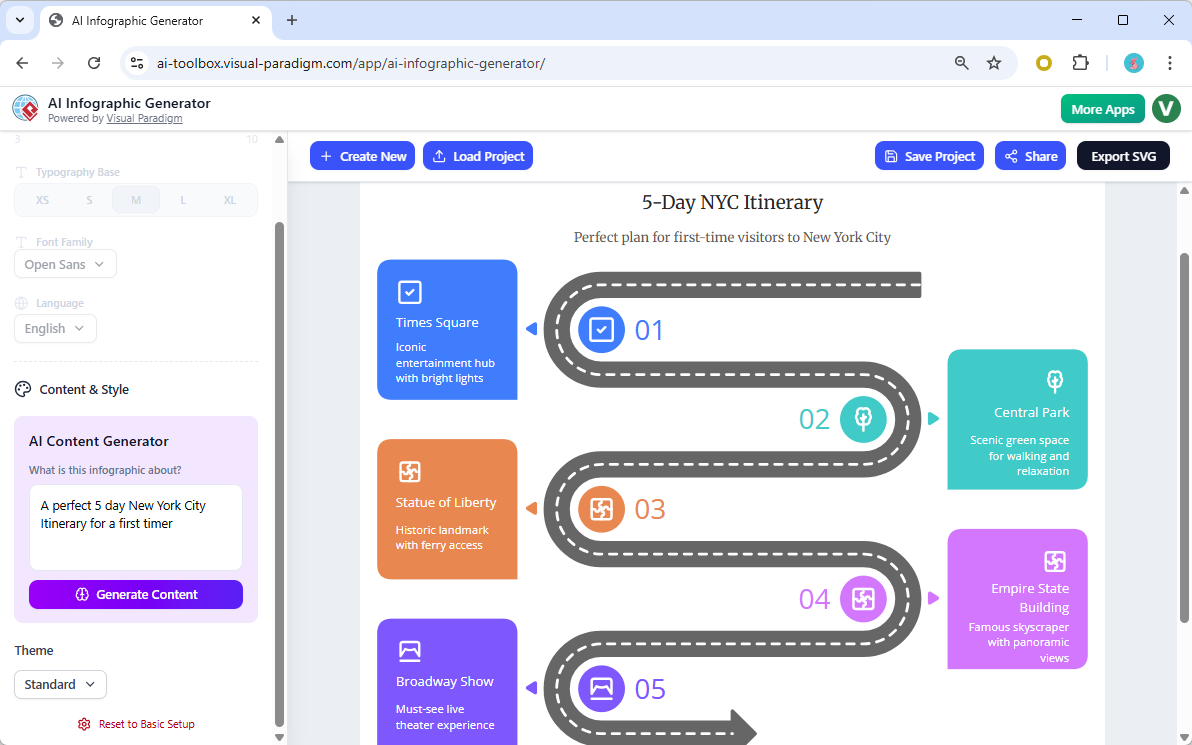
Step 1: Select Your Infographic Template
Begin by choosing from eight professionally designed categories tailored to different storytelling needs:
| Category | Best For | Example Use Case |
|---|---|---|
| Steps & Progression | How-to guides, project milestones | “5 Steps to Launch Your Startup” |
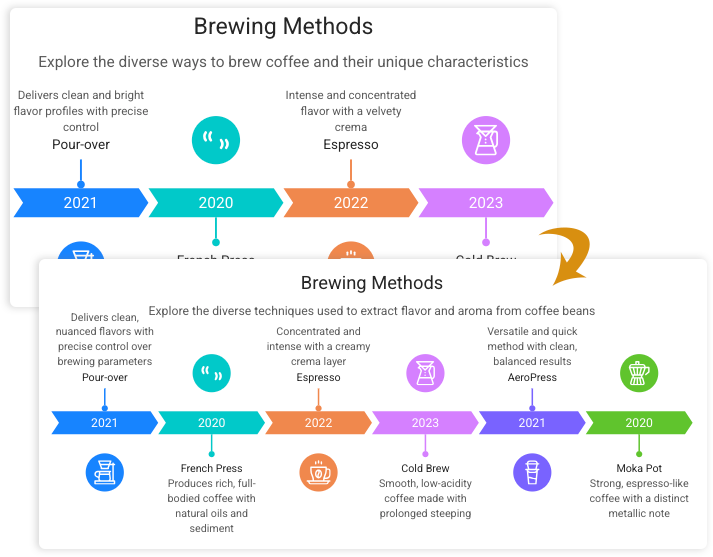
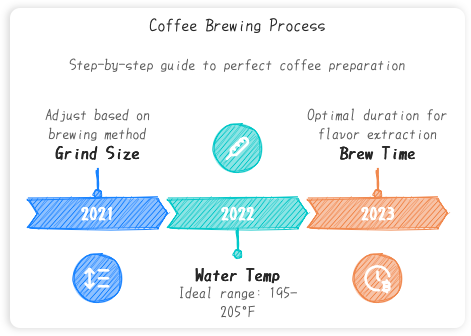
| Pathways & Roadmaps | Strategic planning, timelines | “Q3 Product Development Roadmap” |
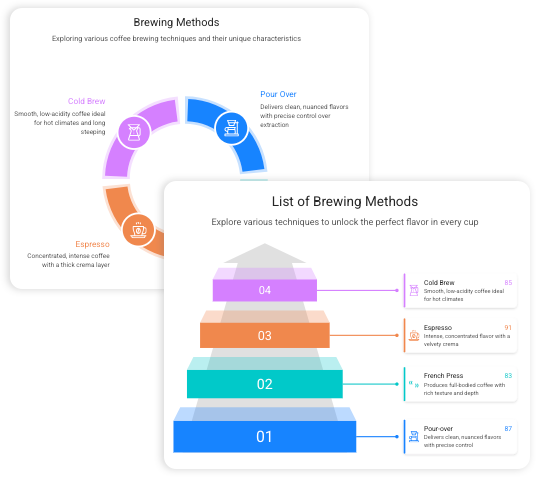
| Lists & Grids | Feature comparisons, resource lists | “Top 10 Marketing Tools for 2026” |
| Data Visualization | Statistics, survey results | “Customer Satisfaction Survey Results” |
| Hierarchies & Mind Maps | Organizational charts, concept mapping | “Company Structure Overview” |
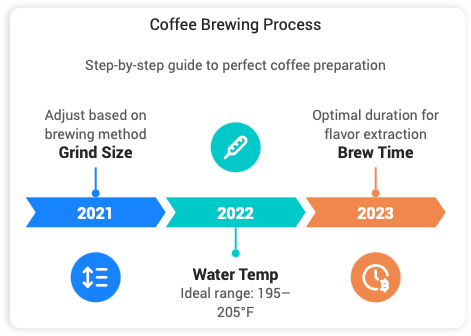
| Processes & Flows | Workflows, decision trees | “Customer Onboarding Process” |
| Comparison & Strategy | Pros/cons, competitive analysis | “SaaS Platform Feature Comparison” |
| Pyramid | Priority frameworks, layered concepts | “Maslow’s Hierarchy for User Needs” |
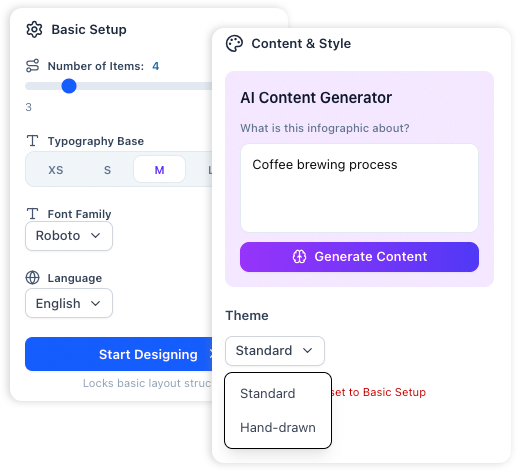
Step 2: Customize & Preview Instantly
Use the intuitive side panel to fine-tune your design in real-time:
-
Adjust the number of items (add or remove sections with one click)
-
Select font family and size for brand consistency
-
Choose your preferred language for global audiences
-
Toggle between Professional and Hand-Drawn style themes
Changes reflect instantly in the preview pane, so you can iterate rapidly without losing momentum.
Step 3: Generate & Refine
Click Start Designing to either:
-
Manually edit text, icons, and layout elements, or
-
Let AI generate smart, structured content from a simple text prompt
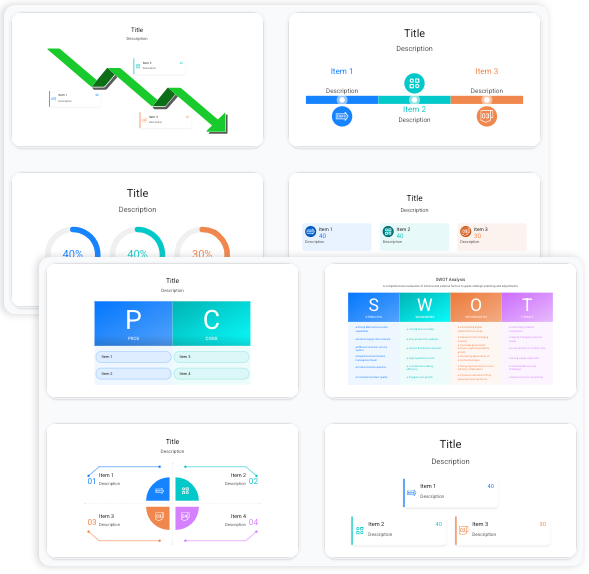
Flexible Layouts That Adapt to Your Content
Unlike rigid template systems, Visual Paradigm’s engine intelligently reshapes your infographic as your content evolves.
Key Flexibility Features:
✅ Add or remove sections without breaking alignment
✅ Auto-resize elements to maintain visual balance
✅ Smart spacing algorithms ensure professional polish
✅ One-click element adjustment for rapid iteration
💡 Pro Tip: Start with fewer items than you think you need. The AI can expand your layout seamlessly, but beginning simple helps you focus on core messaging first.
AI-Powered Content Creation: Let Intelligence Do the Heavy Lifting
Stop staring at blank text boxes. Visual Paradigm’s AI doesn’t just design—it thinks.
Smart Content Generation Capabilities:
🔍 Smart Research: The AI scans relevant knowledge bases to suggest accurate facts, statistics, and talking points for your topic
📐 Structured Layouts: Content is automatically organized into logical sections with clear visual hierarchy
✍️ Tone Adaptation: Choose formal, conversational, or educational tones to match your audience
Prompt Writing Guidelines:
| Prompt Type | Example | Best For |
|---|---|---|
| Topic-Only | “Remote work productivity tips” | Quick brainstorming |
| Detailed Brief | “Create a 6-step infographic about sustainable packaging for e-commerce brands, targeting marketing managers” | Professional deliverables |
| Data-Driven | “Visualize these survey results: 78% prefer video tutorials, 65% want mobile access…” | Reports & presentations |
| Style-Specific | “Hand-drawn style infographic explaining blockchain to beginners” | Educational content |
Design & Theme Selection: Match Your Message to Your Medium
Professional Polish
Ideal for: Business reports, investor decks, corporate communications
Features: Clean lines, structured grids, corporate color palettes, precise alignment
Hand-Drawn Charm
Ideal for: Educational content, blog posts, social media, creative pitches
Features: Sketched shapes, organic lines, playful typography, warm color tones
🎨 Design Guideline: Use Professional style for external stakeholders and formal contexts. Reserve Hand-Drawn for internal collaboration, learning materials, or brands with a playful identity.
Export & Sharing: Distribute Your Visuals with Confidence
Your infographic is only as valuable as its reach. Visual Paradigm ensures your creations look perfect everywhere.
Export Options:
📤 SVG Export: Vector format that scales infinitely—perfect for print, web, or presentations
🔗 Instant Share Links: Generate a unique URL for clients or teammates to view online
📱 Responsive Ready: Designs automatically adapt to mobile, tablet, and desktop screens
Best Practices for Distribution:
-
Use SVG for logos, icons, or any element requiring crisp scaling
-
Share web links for quick feedback cycles before final export
-
Embed infographics in blogs using the provided iframe code for seamless integration
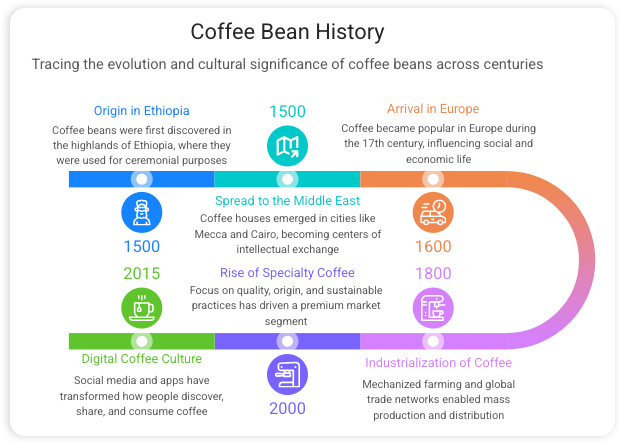
Practical Examples & Use Cases
Example 1: Marketing Campaign Timeline
Prompt: “Create a roadmap infographic showing our Q2 product launch: research (weeks 1-2), design (3-4), development (5-7), testing (8), launch (9)”
Template: Pathways & Roadmaps
Style: Professional
Output: A clean, horizontal timeline with milestone markers and color-coded phases
Example 2: Educational Concept Explainer
Prompt: “Hand-drawn style infographic explaining photosynthesis to middle school students: sunlight, water, CO2, chloroplasts, glucose, oxygen”
Template: Processes & Flows
Style: Hand-Drawn
Output: Friendly, illustrated flow diagram with simple icons and conversational labels
Example 3: Data-Driven Report Summary
Prompt: “Visualize customer survey data: 82% satisfaction rate, 4.7/5 average rating, top 3 requested features: mobile app, dark mode, export options”
Template: Data Visualization
Style: Professional
Output: Clean bar charts and icon-based stats with clear hierarchy
Tips & Best Practices for Maximum Impact
✅ Do:
-
Start with a clear objective: What should viewers do or remember after seeing your infographic?
-
Use concise, action-oriented language (aim for <15 words per text block)
-
Maintain consistent color coding for related concepts
-
Preview on mobile before sharing externally
-
Save multiple versions when iterating on AI-generated content
❌ Avoid:
-
Overloading with text—infographics should simplify, not complicate
-
Using more than 3-4 colors in a single design (unless data-driven)
-
Ignoring brand guidelines for professional deliverables
-
Skipping the preview step before export
🔁 Iteration Workflow:
-
Generate initial version with AI prompt
-
Review content accuracy and visual balance
-
Tweak prompt or manually adjust elements
-
Regenerate or refine
-
Export and share
💬 FAQ Highlight: “Can I change the text after it’s made?”
Yes! Simply edit your prompt and regenerate, or manually adjust text fields in the editor. The flexible layout ensures changes integrate smoothly.
Key Features at a Glance
| Feature | Benefit | Ideal For |
|---|---|---|
| No Design Skills Needed | Create pro visuals without training | Beginners, time-pressed professionals |
| AI Content Generation | Skip blank-page syndrome | Writers, strategists, educators |
| Flexible Templates | Adapt layouts to your content, not vice versa | Dynamic projects, evolving briefs |
| Real-Time Preview | See changes instantly, reduce revision cycles | Collaborative teams, client reviews |
| SVG Export | Print-ready quality at any scale | Marketing materials, presentations |
| One-Click Sharing | Fast feedback and distribution | Remote teams, stakeholder updates |
Conclusion: Empower Your Visual Storytelling Journey
Visual Paradigm’s AI Infographic Generator isn’t just another design tool—it’s a strategic advantage. By removing technical barriers and amplifying creative potential, it empowers professionals across industries to communicate complex ideas with clarity, speed, and style.
Whether you’re launching a campaign, teaching a concept, or presenting data to leadership, the ability to transform notes into polished visuals in minutes is transformative. With intelligent content suggestions, adaptive layouts, and professional-grade export options, you’re equipped to create infographics that don’t just inform—they inspire action.
The future of visual communication is accessible, intelligent, and beautifully simple. Start creating today, and let your ideas shine.
🚀 Try the AI Infographic Generator Now
References
-
AI Infographic Generator – Try It Now: Direct access to Visual Paradigm’s AI-powered infographic creation tool for instant visual storytelling.
-
AI-Powered Infographic Generator – Feature Overview: Comprehensive landing page detailing capabilities, templates, and workflow for the AI infographic tool.