


Introduction
In today’s fast-paced business environment, teams face complex problems daily. Whether it’s declining customer satisfaction, operational bottlenecks, or resource constraints, identifying the problem is only half the battle. The real challenge lies in systematically evaluating potential solutions and choosing the right course of action.
Traditional brainstorming sessions often result in scattered ideas with no clear path to implementation. Spreadsheets become overwhelming, and important connections between root causes and solutions get lost. This is where the Solution Selection Matrix transforms the way you approach problem-solving.
This comprehensive beginner’s guide will walk you through everything you need to know about creating, analyzing, and implementing solutions using the Solution Selection Matrix framework—powered by Visual Paradigm’s next-generation AI diagramming tools. By the end of this tutorial, you’ll be equipped to tackle any organizational challenge with confidence and clarity.
What is a Solution Selection Matrix?
The Solution Selection Matrix is an end-to-end strategic framework that bridges the gap between problem identification and executable action plans. Unlike traditional diagrams that stop at identifying causes, this powerful tool takes you through the complete journey:
-
Problem Discovery → What’s wrong?
-
Root Cause Analysis → Why is it happening?
-
Solution Design → How can we fix it?
-
Method Definition → What specific actions do we take?
-
Strategic Evaluation → Which actions should we prioritize?
The magic happens in the integrated evaluation matrix, where every proposed method is scored against six critical dimensions: Cost, Effort, Impact, Risk, Speed, and Actionability. This gives you an instant visual comparison of which solutions deliver the best return on investment.
Why This Framework Matters
The Traditional Problem-Solving Trap
Most teams approach problems in fragmented ways:
-
Brainstorming sessions on whiteboards (great ideas, no structure)
-
Excel spreadsheets for evaluation (numbers without context)
-
Mind maps for causes (visual but disconnected from actions)
-
Project management tools for execution (tasks without strategic alignment)
The Solution Selection Matrix Advantage
This framework solves all these issues by providing:
✅ Complete Traceability: Every action item links back to its root cause
✅ Visual Clarity: See the entire problem-solution landscape at a glance
✅ Data-Driven Decisions: Compare solutions using consistent criteria
✅ Stakeholder Alignment: Presentation-ready documentation for leadership
✅ AI-Powered Speed: Generate complex analyses in seconds, not hours
Understanding the Five-Level Structure
The Solution Selection Matrix follows a hierarchical flow from abstract problem to concrete action:
Level 0: The Problem (Root Node)
The central issue you’re trying to solve. This should be specific, measurable, and time-bound.
Example: “Customer Complaints Increased (+45% in Q3)”
Level 1: The Causes
The underlying reasons why the problem exists. These are the “why” behind the problem.
Examples:
-
Inadequate Training on New Service Procedures
-
No Standardized Training Program
-
Lack of Ongoing Skill Reinforcement
Level 2: The Solutions
High-level strategies designed to eliminate or mitigate each cause.
Examples:
-
Develop Structured Training Program
-
Create Quick-Reference Job Aids
-
Implement Certification Process
Level 3: The Practical Methods
Granular, actionable tactics required to implement each solution. These are your actual to-do items.
Examples:
-
Design role-specific curriculum & materials
-
Deliver instructor-led training (4 sessions)
-
Create 1-page guides for each procedure
Level 4: The Selection Matrix & Action
A comprehensive evaluation table where every method is scored and prioritized.
Getting Started with Visual Paradigm AI
Prerequisites
-
A Visual Paradigm account (free or paid)
-
Access to the AI Diagramming Chatbot V2
-
Basic understanding of your business problem
Accessing the Tool
-
Navigate to Visual Paradigm AI Chatbot
-
Ensure you’re using the V2 engine (latest version)
-
Familiarize yourself with the chat interface
Crafting Effective Prompts
The quality of your output depends on the quality of your input. Here’s how to write great prompts:
❌ Weak Prompt:
“Help me with customer complaints”
✅ Strong Prompt:
“Generate a Solution Selection Matrix to address the 45% increase in customer complaints in Q3 due to inadequate staff training on new service procedures”
Key Elements of a Strong Prompt:
-
Specify the framework: “Solution Selection Matrix”
-
Define the problem clearly with metrics
-
Include context or contributing factors
-
Mention the scope or timeframe
Step-by-Step: Creating Your First Matrix
Step 1: Define Your Problem Statement
Start with a clear, specific problem. Avoid vague statements.
Good Examples:
-
“Employee Turnover Rate Increased to 28% in 2025”
-
“Software Deployment Failures Up 60% This Quarter”
-
“Warehouse Picking Errors Causing 15% Order Delays”
Step 2: Identify the Prompt Structure
Use this template:
Generate a Solution Selection Matrix to [solve/address] [specific problem]
caused by [main causes or context]
Step 3: Submit to AI Chatbot
Enter your prompt in the Visual Paradigm AI Chatbot and hit enter.
Step 4: Review the Generated Diagram
The AI will automatically create:
-
A hierarchical flowchart (left to right)
-
Color-coded nodes (Problem in red, Causes in orange, Solutions in teal, Methods in purple)
-
An embedded evaluation matrix with all methods listed
Step 5: Analyze the Results
Look for:
-
Quick Wins: Low cost, low effort, high impact, fast speed
-
Strategic Investments: High cost/effort but high impact
-
Low Priority: Low impact regardless of other factors
Step 6: Make Decisions
Use the “Take Action (Y/N)” column to mark which methods to implement.
Real-World Examples with PlantUML Code
Example 1: Reducing Employee Turnover in a Tech Startup
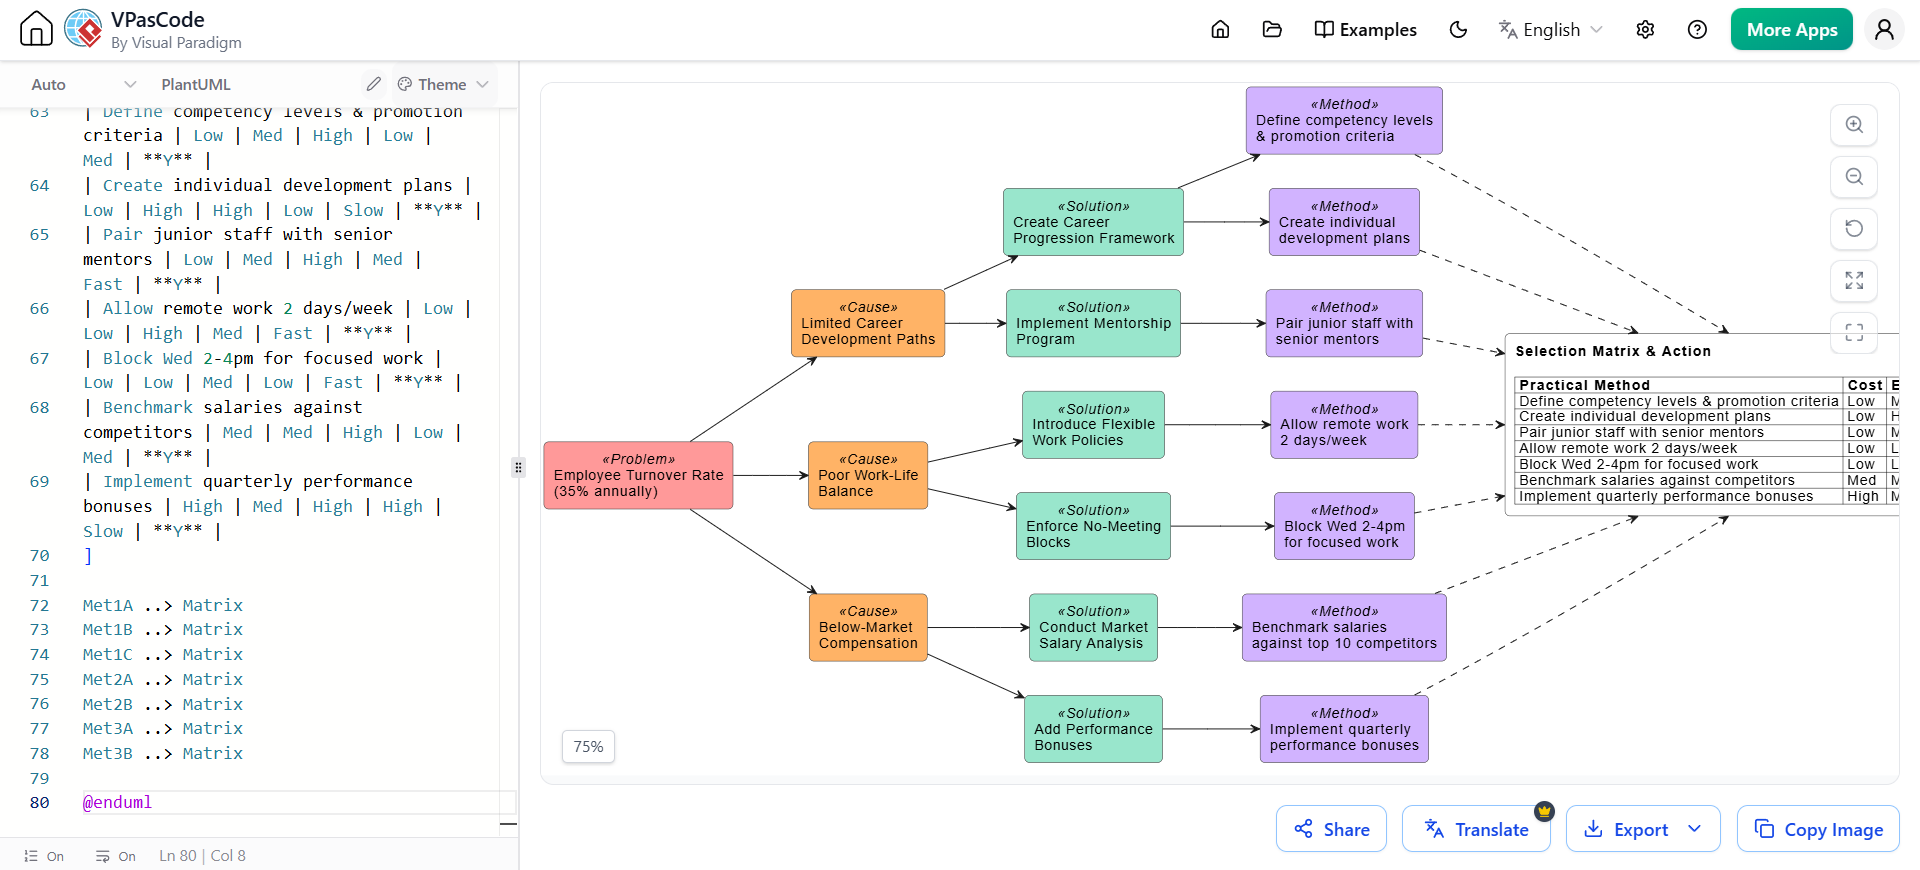
Scenario: A growing tech company is experiencing 35% annual employee turnover, well above the industry average of 15%. Exit interviews reveal three main issues: lack of career development, poor work-life balance, and inadequate compensation.
Let’s generate a Solution Selection Matrix for this scenario:
@startuml
left to right direction

skinparam RectangleBackgroundColor white
skinparam RectangleBorderColor #333333
skinparam RoundCorner 10

!define PROBLEM_COLOR #FF9999
!define CAUSE_COLOR #FFB366
!define SOLUTION_COLOR #99E6CC
!define METHOD_COLOR #D1B3FF

skinparam rectangle {
    BackgroundColor<<Problem>> PROBLEM_COLOR
    BackgroundColor<<Cause>> CAUSE_COLOR
    BackgroundColor<<Solution>> SOLUTION_COLOR
    BackgroundColor<<Method>> METHOD_COLOR
}

rectangle "Employee Turnover Rate\n(35% annually)" as Problem <<Problem>>
rectangle "Limited Career\nDevelopment Paths" as Cause1 <<Cause>>
rectangle "Poor Work-Life\nBalance" as Cause2 <<Cause>>
rectangle "Below-Market\nCompensation" as Cause3 <<Cause>>

Problem --> Cause1
Problem --> Cause2
Problem --> Cause3

rectangle "Create Career\nProgression Framework" as Sol1A <<Solution>>
rectangle "Implement Mentorship\nProgram" as Sol1B <<Solution>>
rectangle "Introduce Flexible\nWork Policies" as Sol2A <<Solution>>
rectangle "Enforce No-Meeting\nBlocks" as Sol2B <<Solution>>
rectangle "Conduct Market\nSalary Analysis" as Sol3A <<Solution>>
rectangle "Add Performance\nBonuses" as Sol3B <<Solution>>

Cause1 --> Sol1A
Cause1 --> Sol1B
Cause2 --> Sol2A
Cause2 --> Sol2B
Cause3 --> Sol3A
Cause3 --> Sol3B

rectangle "Define competency levels\n& promotion criteria" as Met1A <<Method>>
rectangle "Create individual\ndevelopment plans" as Met1B <<Method>>
rectangle "Pair junior staff with\nsenior mentors" as Met1C <<Method>>
rectangle "Allow remote work\n2 days/week" as Met2A <<Method>>
rectangle "Block Wed 2-4pm\nfor focused work" as Met2B <<Method>>
rectangle "Benchmark salaries\nagainst top 10 competitors" as Met3A <<Method>>
rectangle "Implement quarterly\nperformance bonuses" as Met3B <<Method>>

Sol1A --> Met1A
Sol1A --> Met1B
Sol1B --> Met1C
Sol2A --> Met2A
Sol2B --> Met2B
Sol3A --> Met3A
Sol3B --> Met3B

rectangle Matrix [
<b>Selection Matrix & Action</b>

|= Practical Method |= Cost |= Effort |= Impact |= Risk |= Speed |= Take Action (Y/N) |
| Define competency levels & promotion criteria | Low | Med | High | Low | Med | **Y** |
| Create individual development plans | Low | High | High | Low | Slow | **Y** |
| Pair junior staff with senior mentors | Low | Med | High | Med | Fast | **Y** |
| Allow remote work 2 days/week | Low | Low | High | Med | Fast | **Y** |
| Block Wed 2-4pm for focused work | Low | Low | Med | Low | Fast | **Y** |
| Benchmark salaries against competitors | Med | Med | High | Low | Med | **Y** |
| Implement quarterly performance bonuses | High | Med | High | High | Slow | **Y** |
]

Met1A ..> Matrix
Met1B ..> Matrix
Met1C ..> Matrix
Met2A ..> Matrix
Met2B ..> Matrix
Met3A ..> Matrix
Met3B ..> Matrix

@enduml
Analysis of This Example:
Looking at the matrix, you can immediately identify:
-
Quick Wins: Remote work policy and no-meeting blocks (low cost, low effort, fast implementation)
-
High Impact: All methods score high on impact, showing this is a solvable problem
-
Investment Required: Salary benchmarking and bonuses require budget but are essential for retention
Recommended Action Plan:
-
Week 1-2: Implement flexible work policies (fastest win)
-
Week 3-4: Establish no-meeting blocks and start mentorship pairings
-
Month 2: Define career progression framework
-
Month 3: Complete salary analysis and plan compensation adjustments
Example 2: Solving Traffic Congestion in Rural Areas
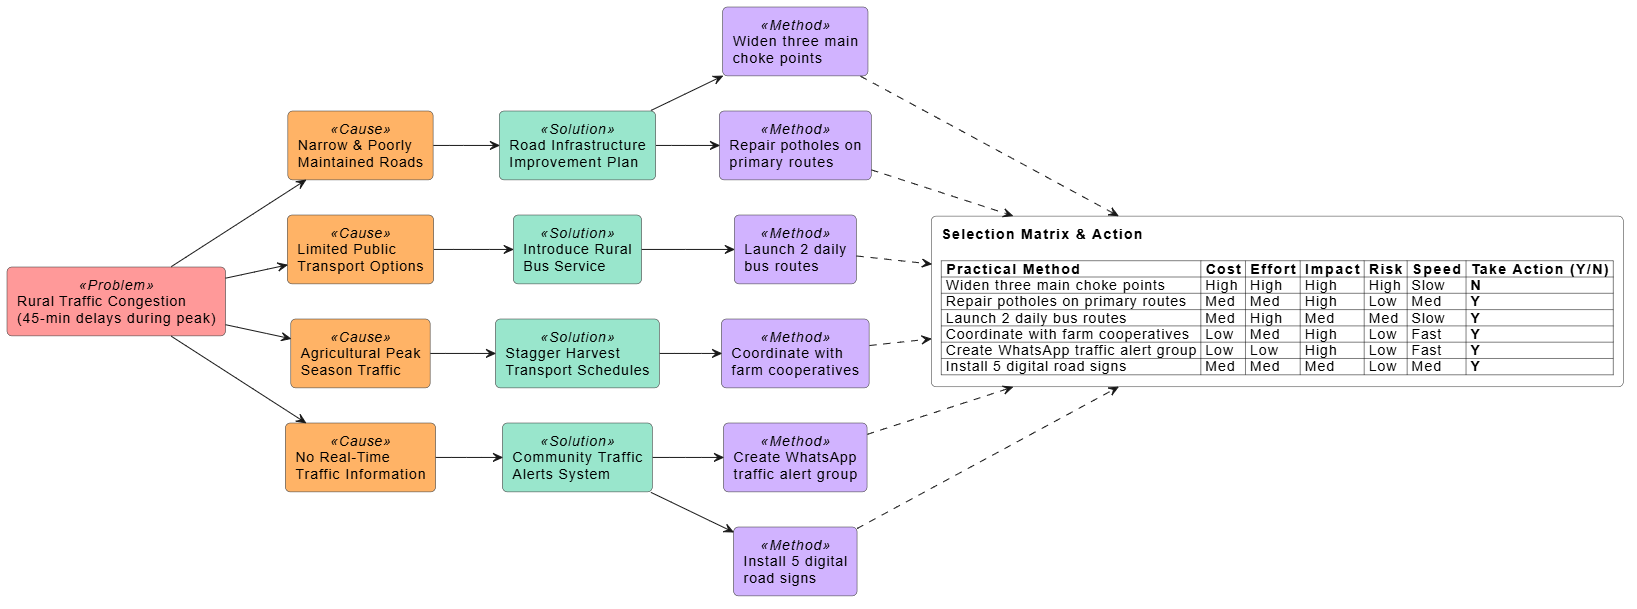
Scenario: A rural county is experiencing severe traffic congestion during peak hours, particularly during agricultural harvest seasons. The narrow roads weren’t designed for current traffic volumes, and there’s no real-time traffic information available to drivers.
@startuml
left to right direction

skinparam RectangleBackgroundColor white
skinparam RectangleBorderColor #333333
skinparam RoundCorner 10

!define PROBLEM_COLOR #FF9999
!define CAUSE_COLOR #FFB366
!define SOLUTION_COLOR #99E6CC
!define METHOD_COLOR #D1B3FF

skinparam rectangle {
    BackgroundColor<<Problem>> PROBLEM_COLOR
    BackgroundColor<<Cause>> CAUSE_COLOR
    BackgroundColor<<Solution>> SOLUTION_COLOR
    BackgroundColor<<Method>> METHOD_COLOR
}

rectangle "Rural Traffic Congestion\n(45-min delays during peak)" as Problem <<Problem>>
rectangle "Narrow & Poorly\nMaintained Roads" as Cause1 <<Cause>>
rectangle "Limited Public\nTransport Options" as Cause2 <<Cause>>
rectangle "Agricultural Peak\nSeason Traffic" as Cause3 <<Cause>>
rectangle "No Real-Time\nTraffic Information" as Cause4 <<Cause>>

Problem --> Cause1
Problem --> Cause2
Problem --> Cause3
Problem --> Cause4

rectangle "Road Infrastructure\nImprovement Plan" as Sol1A <<Solution>>
rectangle "Introduce Rural\nBus Service" as Sol2A <<Solution>>
rectangle "Stagger Harvest\nTransport Schedules" as Sol3A <<Solution>>
rectangle "Community Traffic\nAlerts System" as Sol4A <<Solution>>

Cause1 --> Sol1A
Cause2 --> Sol2A
Cause3 --> Sol3A
Cause4 --> Sol4A

rectangle "Widen three main\nchoke points" as Met1A <<Method>>
rectangle "Repair potholes on\nprimary routes" as Met1B <<Method>>
rectangle "Launch 2 daily\nbus routes" as Met2A <<Method>>
rectangle "Coordinate with\nfarm cooperatives" as Met3A <<Method>>
rectangle "Create WhatsApp\ntraffic alert group" as Met4A <<Method>>
rectangle "Install 5 digital\nroad signs" as Met4B <<Method>>

Sol1A --> Met1A
Sol1A --> Met1B
Sol2A --> Met2A
Sol3A --> Met3A
Sol4A --> Met4A
Sol4A --> Met4B

rectangle Matrix [
<b>Selection Matrix & Action</b>

|= Practical Method |= Cost |= Effort |= Impact |= Risk |= Speed |= Take Action (Y/N) |
| Widen three main choke points | High | High | High | High | Slow | **N** |
| Repair potholes on primary routes | Med | Med | High | Low | Med | **Y** |
| Launch 2 daily bus routes | Med | High | Med | Med | Slow | **Y** |
| Coordinate with farm cooperatives | Low | Med | High | Low | Fast | **Y** |
| Create WhatsApp traffic alert group | Low | Low | High | Low | Fast | **Y** |
| Install 5 digital road signs | Med | Med | Med | Low | Med | **Y** |
]

Met1A ..> Matrix
Met1B ..> Matrix
Met2A ..> Matrix
Met3A ..> Matrix
Met4A ..> Matrix
Met4B ..> Matrix

@enduml
Key Insights:
-
Immediate Action: The WhatsApp alert group and farm cooperative coordination can be implemented within days
-
Long-term Planning: Road widening is marked “N” (No) not because it’s unimportant, but because it requires extensive planning and budget approval
-
Balanced Approach: Mix quick wins (alerts) with medium-term solutions (bus service) and long-term infrastructure (road widening)
Example 3: Improving Software Deployment Success Rate
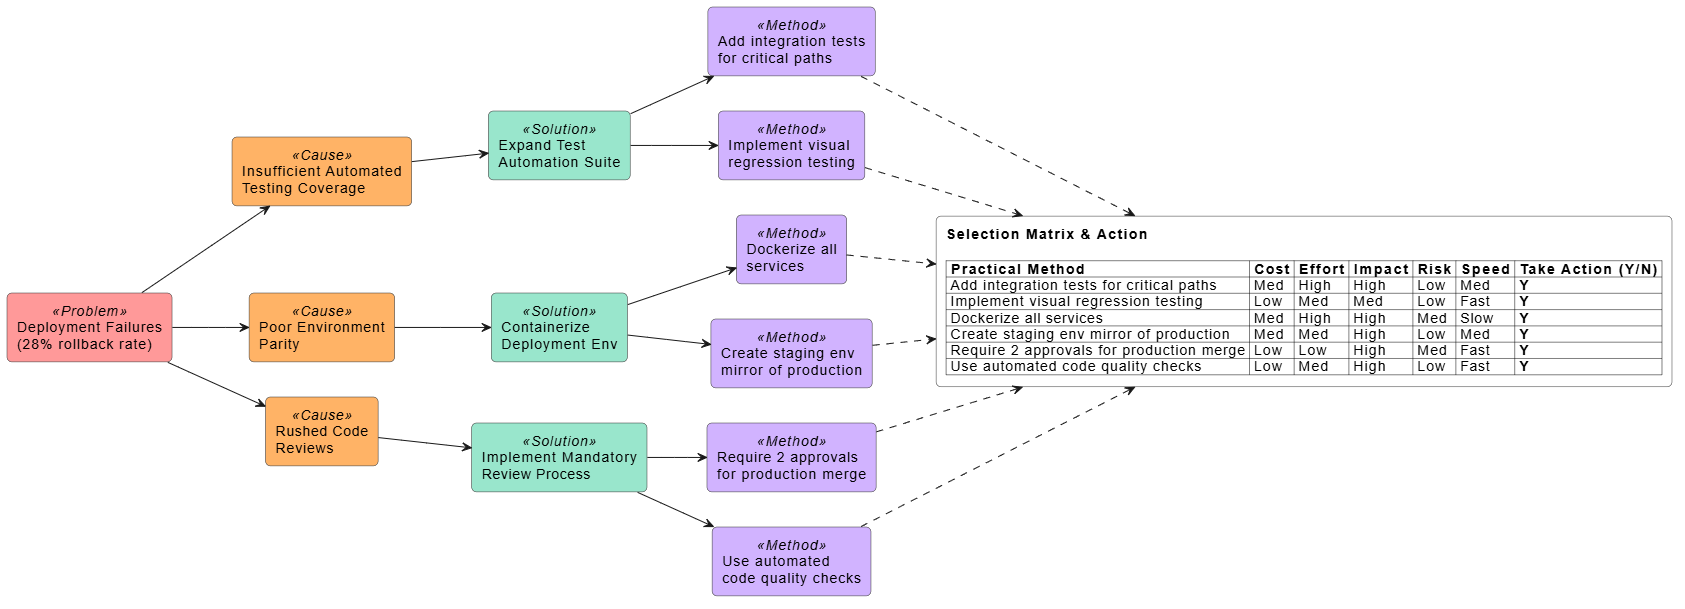
Scenario: A SaaS company’s deployment success rate has dropped to 72%, with 28% of releases requiring hotfixes or rollbacks. This is causing customer dissatisfaction and developer burnout.
@startuml
left to right direction

skinparam RectangleBackgroundColor white
skinparam RectangleBorderColor #333333
skinparam RoundCorner 10

!define PROBLEM_COLOR #FF9999
!define CAUSE_COLOR #FFB366
!define SOLUTION_COLOR #99E6CC
!define METHOD_COLOR #D1B3FF

skinparam rectangle {
    BackgroundColor<<Problem>> PROBLEM_COLOR
    BackgroundColor<<Cause>> CAUSE_COLOR
    BackgroundColor<<Solution>> SOLUTION_COLOR
    BackgroundColor<<Method>> METHOD_COLOR
}

rectangle "Deployment Failures\n(28% rollback rate)" as Problem <<Problem>>
rectangle "Insufficient Automated\nTesting Coverage" as Cause1 <<Cause>>
rectangle "Poor Environment\nParity" as Cause2 <<Cause>>
rectangle "Rushed Code\nReviews" as Cause3 <<Cause>>

Problem --> Cause1
Problem --> Cause2
Problem --> Cause3

rectangle "Expand Test\nAutomation Suite" as Sol1A <<Solution>>
rectangle "Containerize\nDeployment Env" as Sol2A <<Solution>>
rectangle "Implement Mandatory\nReview Process" as Sol3A <<Solution>>

Cause1 --> Sol1A
Cause2 --> Sol2A
Cause3 --> Sol3A

rectangle "Add integration tests\nfor critical paths" as Met1A <<Method>>
rectangle "Implement visual\nregression testing" as Met1B <<Method>>
rectangle "Dockerize all\nservices" as Met2A <<Method>>
rectangle "Create staging env\nmirror of production" as Met2B <<Method>>
rectangle "Require 2 approvals\nfor production merge" as Met3A <<Method>>
rectangle "Use automated\ncode quality checks" as Met3B <<Method>>

Sol1A --> Met1A
Sol1A --> Met1B
Sol2A --> Met2A
Sol2A --> Met2B
Sol3A --> Met3A
Sol3A --> Met3B

rectangle Matrix [
<b>Selection Matrix & Action</b>

|= Practical Method |= Cost |= Effort |= Impact |= Risk |= Speed |= Take Action (Y/N) |
| Add integration tests for critical paths | Med | High | High | Low | Med | **Y** |
| Implement visual regression testing | Low | Med | Med | Low | Fast | **Y** |
| Dockerize all services | Med | High | High | Med | Slow | **Y** |
| Create staging env mirror of production | Med | Med | High | Low | Med | **Y** |
| Require 2 approvals for production merge | Low | Low | High | Med | Fast | **Y** |
| Use automated code quality checks | Low | Med | High | Low | Fast | **Y** |
]

Met1A ..> Matrix
Met1B ..> Matrix
Met2A ..> Matrix
Met2B ..> Matrix
Met3A ..> Matrix
Met3B ..> Matrix

@enduml
Implementation Priority:
-
Week 1: Implement mandatory 2-approval process (immediate quality gate)
-
Week 2-3: Set up automated code quality checks
-
Month 1-2: Create production mirror in staging
-
Month 2-3: Expand test coverage gradually
-
Quarter 2: Complete containerization project
Editing and Customizing Your Diagram
Using VPasCode for Advanced Editing
Once your Solution Selection Matrix is generated, you might want to customize it. Visual Paradigm’s VPasCode platform makes this easy.
Step-by-Step Editing Process:
-
Open in VPasCode: Click the “Open in VPasCode” button below your generated diagram
-
Edit PlantUML Syntax: Modify colors, add/remove nodes, or adjust the matrix
-
Preview Changes: See updates in real-time
-
Export: Download as PNG, SVG, or PDF for presentations
Common Customizations:
Changing Color Schemes
!define PROBLEM_COLOR #FF6B6B
!define CAUSE_COLOR #4ECDC4
!define SOLUTION_COLOR #45B7D1
!define METHOD_COLOR #FFA07A
Adding Custom Styling
skinparam rectangle {
    BackgroundColor<<Problem>> PROBLEM_COLOR
    BorderColor<<Problem>> #CC0000
    FontName<<Problem>> Arial
    FontSize<<Problem>> 14
}
Modifying the Matrix
Simply edit the table rows to update scores or add new methods:
|= Practical Method |= Cost |= Effort |= Impact |= Risk |= Speed |= Take Action (Y/N) |
| Your new method here | Low | Med | High | Low | Fast | **Y** |
Best Practices for Maximum Impact
1. Be Specific with Problem Statements
❌ Bad: “Sales are down”
✅ Good: “Q3 sales revenue decreased 22% compared to Q2, missing targets by $450K”
2. Limit Causes to 3-5 Key Factors
Too few causes = oversimplification
Too many causes = analysis paralysis
Sweet spot: 3-5 major root causes
3. Make Methods Actionable and Measurable
Vague: “Improve communication”
✅ Specific: “Implement weekly 30-min standup meetings every Monday at 10 AM”
4. Use Consistent Evaluation Criteria
Ensure all team members interpret “High/Medium/Low” the same way:
Cost Scale:
-
Low: < $5K
-
Med: $5K – $50K
-
High: > $50K
Speed Scale:
-
Fast: < 2 weeks
-
Med: 2-8 weeks
-
Slow: > 8 weeks
5. Involve Stakeholders in Scoring
Don’t evaluate methods in isolation. Get input from:
-
Finance team (for cost estimates)
-
Technical leads (for effort assessment)
-
End users (for impact validation)
6. Revisit and Update
The matrix is a living document. Update it when:
-
New information emerges
-
Market conditions change
-
Initial assumptions prove incorrect
-
Resources become available or constrained
7. Focus on Quick Wins First
Prioritize methods that are:
-
Low cost
-
Low effort
-
High impact
-
Fast to implement
These build momentum and demonstrate progress to stakeholders.
8. Don’t Ignore High-Effort, High-Impact Items
While quick wins are important, some strategic initiatives require significant investment. Mark these for long-term planning rather than dismissing them.
9. Use the Matrix for Communication
Share the completed matrix with:
-
Executive leadership (for budget approval)
-
Implementation teams (for clarity on priorities)
-
External stakeholders (for transparency)
10. Track Actual vs. Estimated Metrics
After implementation, compare:
-
Actual cost vs. estimated cost
-
Actual time vs. estimated speed
-
Actual results vs. expected impact
This improves future estimation accuracy.
Advanced Tips for Power Users
Combining Multiple Matrices
For complex organizational challenges, create separate matrices for different departments or problem areas, then synthesize findings at the executive level.
Integrating with Project Management Tools
Export your “Take Action = Y” items directly into:
-
Jira for development teams
-
Asana for marketing campaigns
-
Monday.com for operations
Creating Scenario Comparisons
Generate multiple matrices for the same problem with different assumptions:
-
Optimistic scenario: Best-case resource availability
-
Conservative scenario: Limited budget constraints
-
Crisis scenario: Urgent timeline requirements
Using AI Iteratively
Don’t stop at the first generation. Refine your prompt:
First Prompt:
“Generate a Solution Selection Matrix for customer churn”
Refined Prompt:
“Regenerate the matrix focusing only on solutions under $10K budget and implementation time under 4 weeks”
Conclusion
The Solution Selection Matrix represents a paradigm shift in how teams approach complex problems. By combining systematic root cause analysis with strategic evaluation and AI-powered speed, this framework eliminates the guesswork from decision-making and provides a clear roadmap from problem to solution.
Key Takeaways:
-
Structure Drives Success: The five-level hierarchy ensures you don’t skip critical steps in problem-solving
-
AI Accelerates Process: What used to take days of workshops and spreadsheet manipulation now takes minutes
-
Visual Clarity Wins: Stakeholders can instantly understand the problem landscape and proposed solutions
-
Data-Driven Decisions: The evaluation matrix removes bias and emotion from prioritization
-
Actionable Outcomes: Every method is traceable, measurable, and tied to specific root causes
Your Next Steps:
-
Identify a Current Challenge: Choose one pressing problem your team is facing
-
Craft Your Prompt: Use the templates provided in this guide
-
Generate Your First Matrix: Visit Visual Paradigm AI Chatbot and create your diagram
-
Share with Your Team: Use the matrix to align on priorities and action items
-
Iterate and Improve: Refine your approach based on results and feedback
Remember, the best problem-solving framework is the one you actually use. The Solution Selection Matrix removes all barriers to entry—no complex software to learn, no extensive training required, and no time-consuming setup. With Visual Paradigm’s AI-powered tools, you’re just one prompt away from transforming chaos into clarity.
Start Today: Pick one problem, write one prompt, and watch as your Solution Selection Matrix reveals the path forward. Your future self—and your team—will thank you.
Additional Resources: