Introduction
A flowchart is far more than a collection of boxes and arrows; it is a visual language for translating abstract logic into a concrete, communicable process. As the learning objectives of the source material suggest, mastering flowcharts bridges the gap between understanding an algorithm and actually implementing it in hardware and code. By representing a workflow or algorithm as a step-by-step diagram, flowcharts allow developers, engineers, and students to analyze problems, identify bottlenecks, and design solutions before committing to physical components or complex syntax .
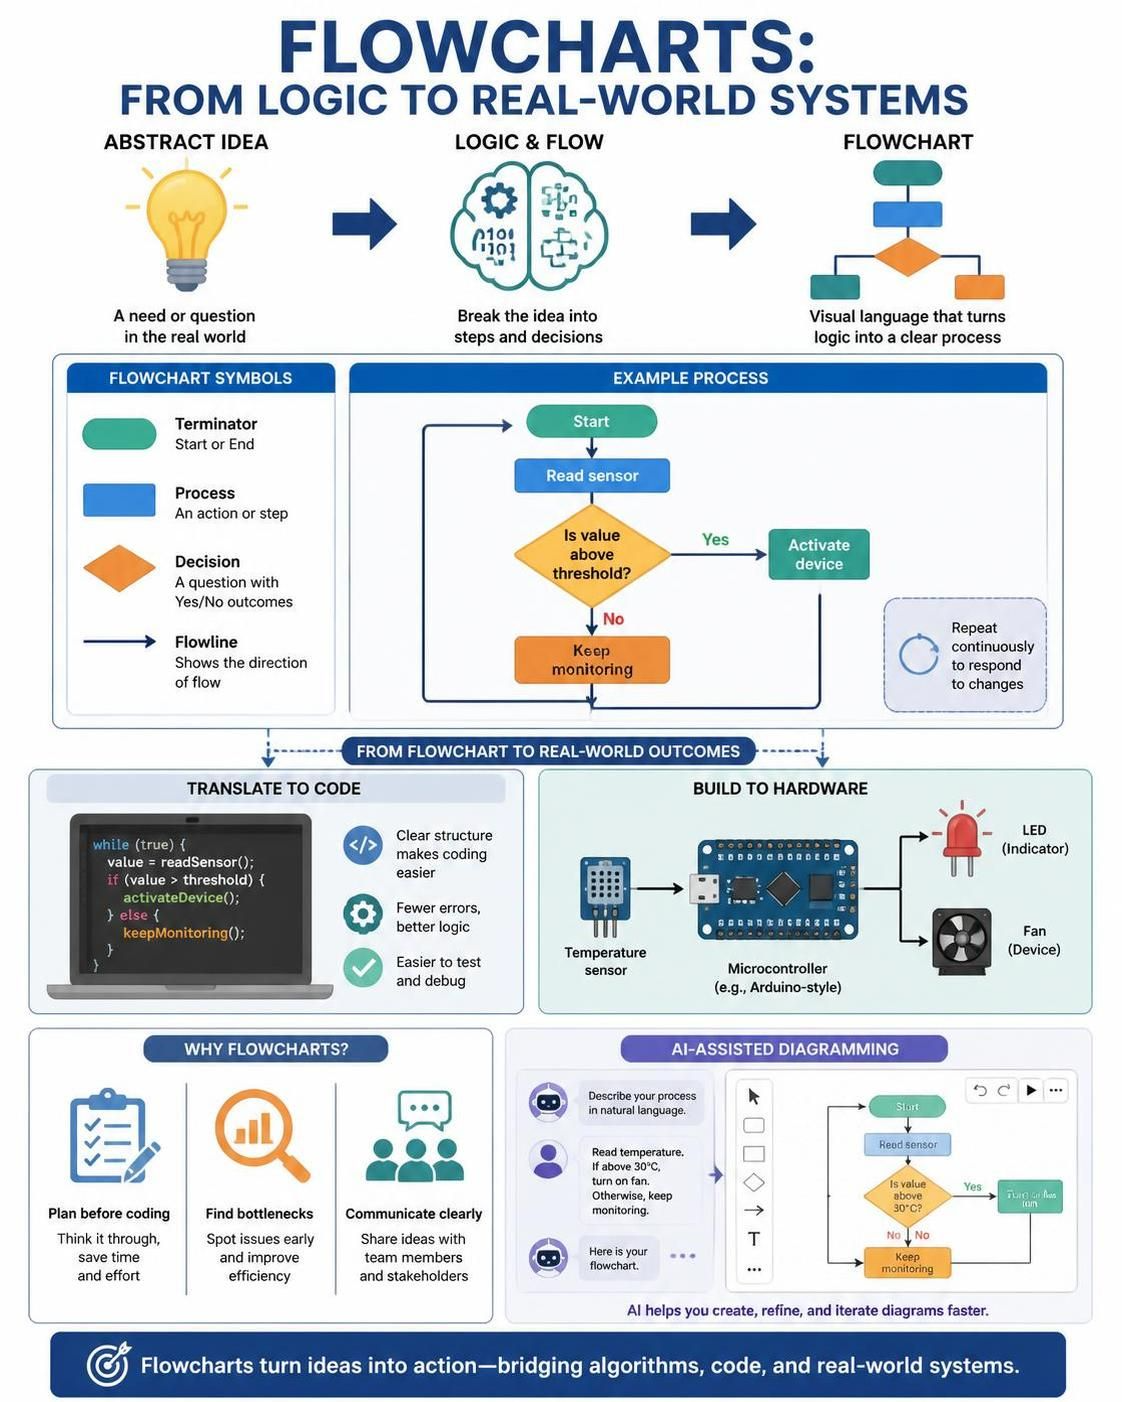
This guide explores the foundational concepts of flowcharts, their role in problem-solving, and how modern tools like Visual Paradigm, augmented by AI, streamline the path from initial logic design to functional sensor-based prototypes.
Key Concepts: The Anatomy of a Flowchart
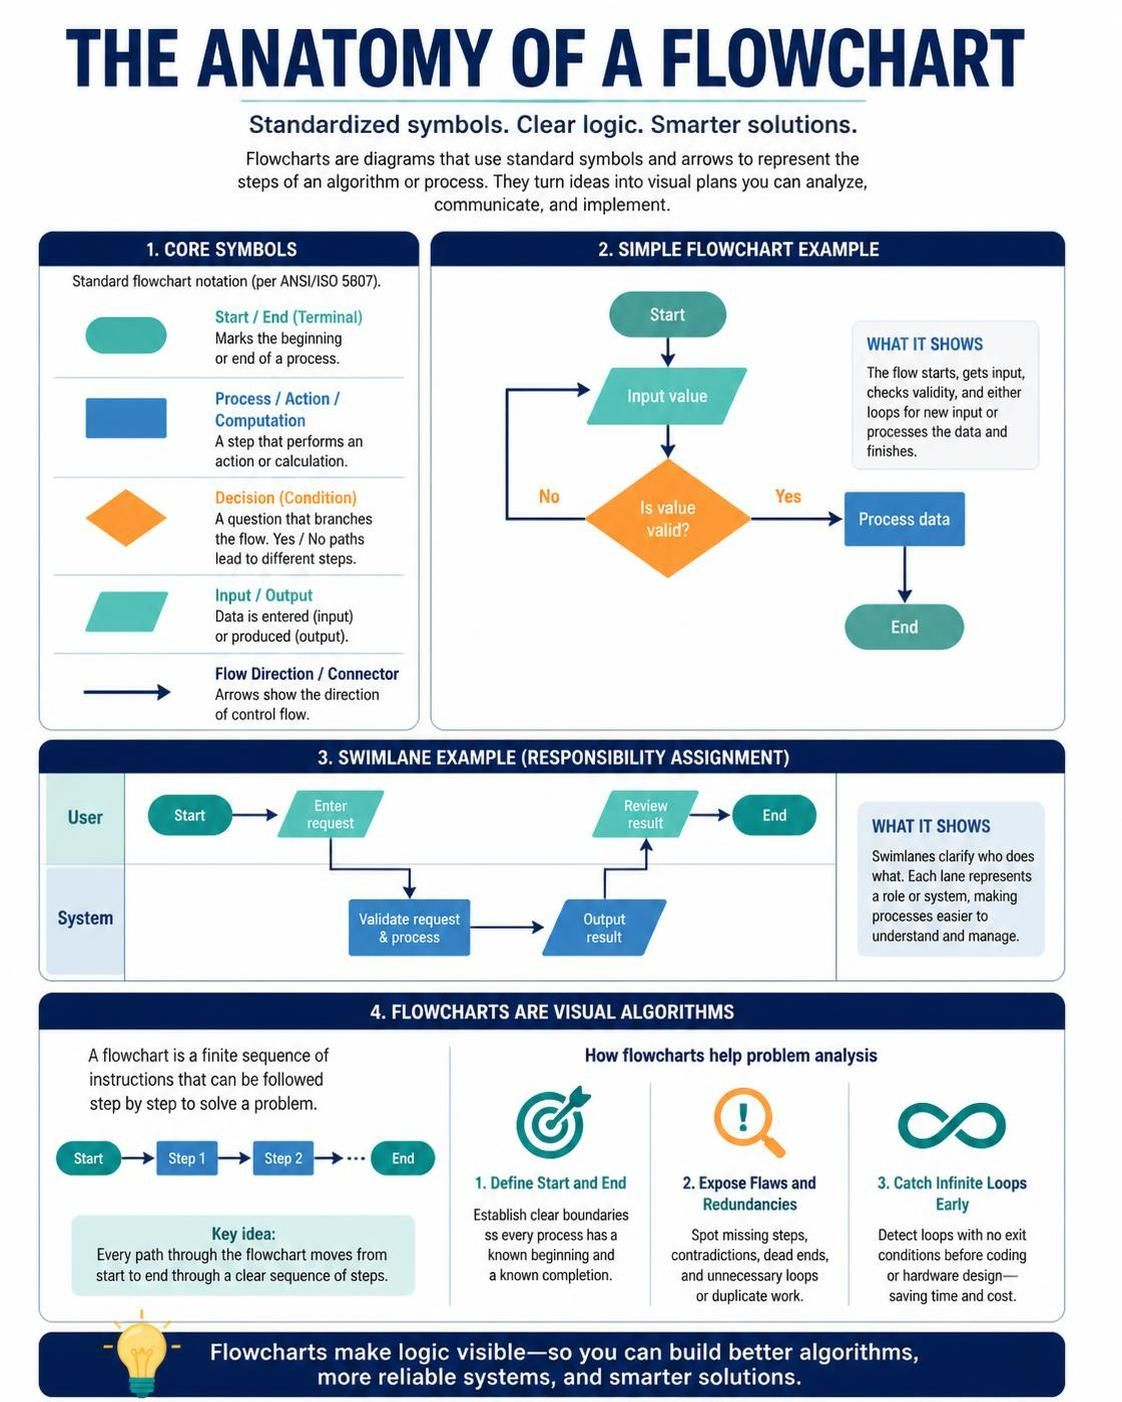
To use flowcharts effectively, one must first understand their standardized vocabulary. A flowchart visualizes a process by breaking it down into discrete steps represented by geometric symbols, connected by arrows that dictate the flow of control .
Core Symbols and Their Meanings
The power of a flowchart lies in its universal notation. While variations exist, the core symbol set—codified by standards such as ISO 5807—remains consistent across disciplines . The oval or rounded rectangle denotes the start or end of a process (terminal). The rectangle represents a process step, action, or computation. The diamond is reserved for decisions, where a condition is tested, and the flow branches into different paths (e.g., Yes/No). Parallelograms signify input or output operations, while arrows serve as the connectors that show the direction of the process flow . In more complex scenarios, cross-functional flowcharts divide the diagram into vertical or horizontal “swimlanes” to assign responsibility for specific steps to different organizational units or hardware components .
Algorithms and Problem Analysis
A flowchart is essentially a pictorial representation of an algorithm—a finite, step-by-step set of instructions designed to solve a specific problem . The process of creating a flowchart forces the designer to engage in rigorous problem analysis. By defining the start and end points, identifying the major steps, and isolating the decision points, one exposes logical flaws, redundancies, or infinite loops that might not be obvious in textual code or narrative descriptions . This analytical phase is crucial before moving to the “hands-on” hardware stage, as it ensures the subsequent coding and circuit design are built upon a sound logical foundation.
From Diagram to Device: Flowcharts in Hardware and Coding
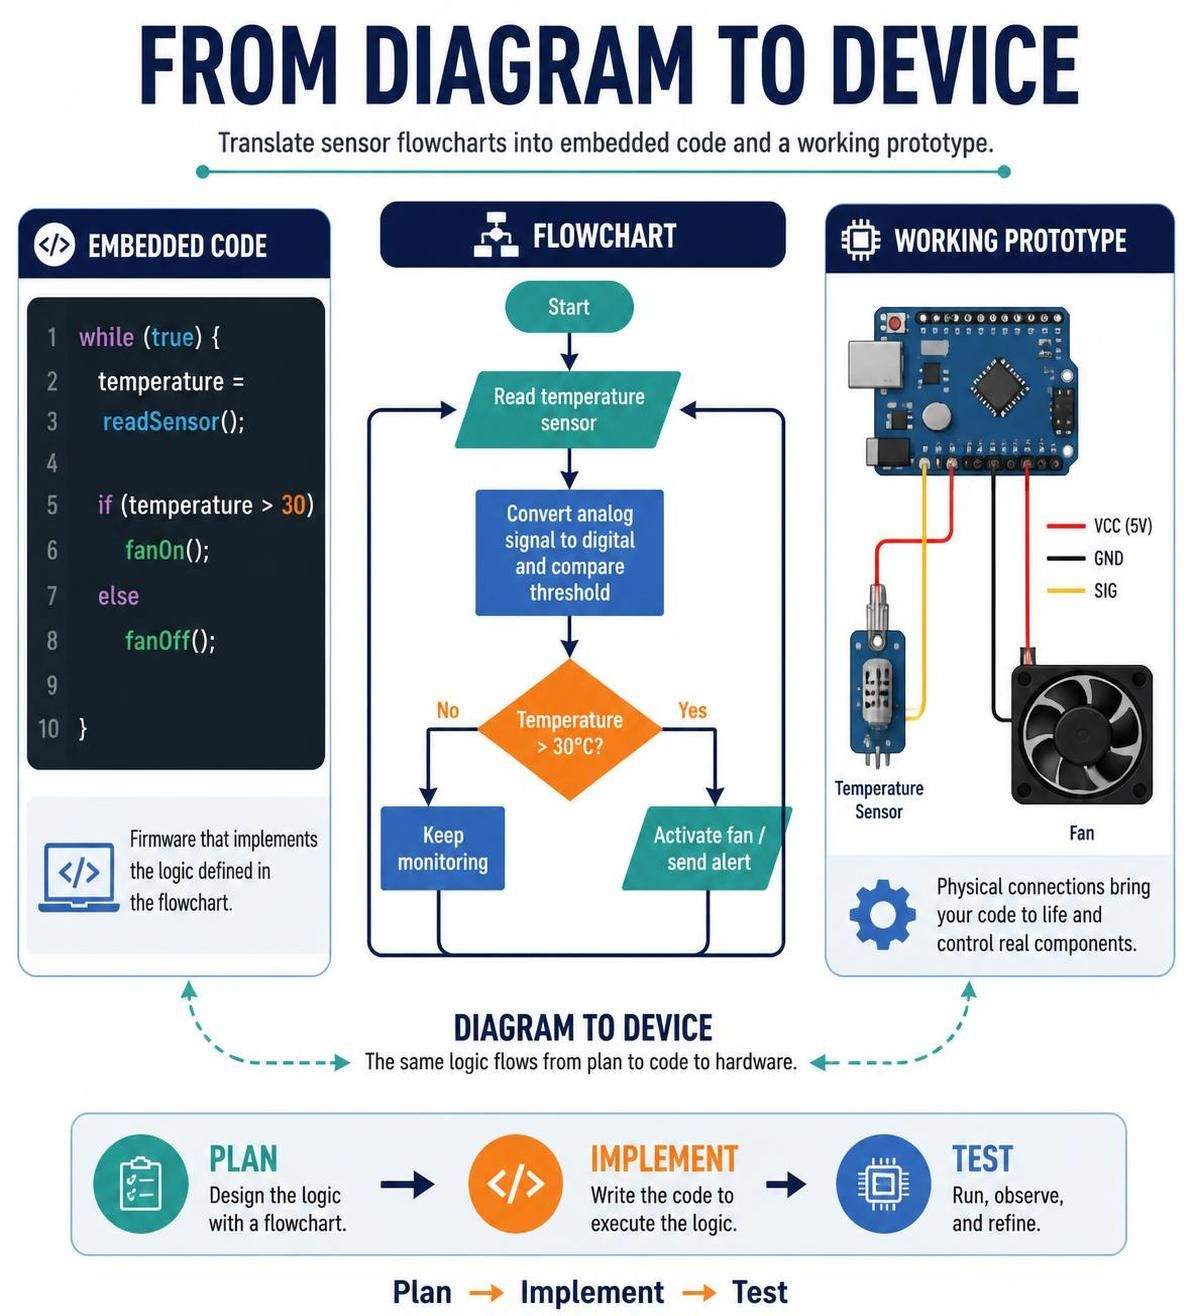
The learning objectives explicitly link flowcharts to gaining hands-on experience with hardware and understanding sensor-based prototyping. In this context, a flowchart serves as the blueprint for embedded systems and IoT devices.
Prototyping Logic with Sensors
Prototyping involves creating a working model of a product to test a concept. When dealing with sensors, the flowchart becomes a map of data processing. For example, consider a system designed to trigger an action based on environmental input. The flowchart would begin with an Input block (read sensor data), followed by a Process block (e.g., convert analog signal to digital, apply a threshold), a Decision block (e.g., “Is temperature > 30°C?”), and finally an Output block (e.g., activate a fan or send an alert). This visual logic directly translates into the conditional statements (if/else) and loops (while) used in firmware development .
Visual Paradigm and AI: Accelerating the Design Phase
Tooling plays a significant role in modernizing this workflow. Visual Paradigm, a visual modeling platform, allows users to create standards-compliant flowcharts with ease. More importantly, the integration of Artificial Intelligence (AI) has streamlined the initial drafting phase. Instead of manually drawing every shape, a developer can input a natural language prompt—such as “Create a flowchart for a sensor system that detects motion, waits for 5 seconds, and then activates a light”—and the AI will generate a structured layout with appropriate symbols and connectors . This AI-assisted generation removes the “blank canvas” friction, allowing the designer to focus on refining the logic and optimizing the hardware interaction rather than wrestling with alignment and shape placement .
Examples: A Sensor-Triggered Alert System
VP AI Chartbot for Generating Flowchart with Mermaid Code
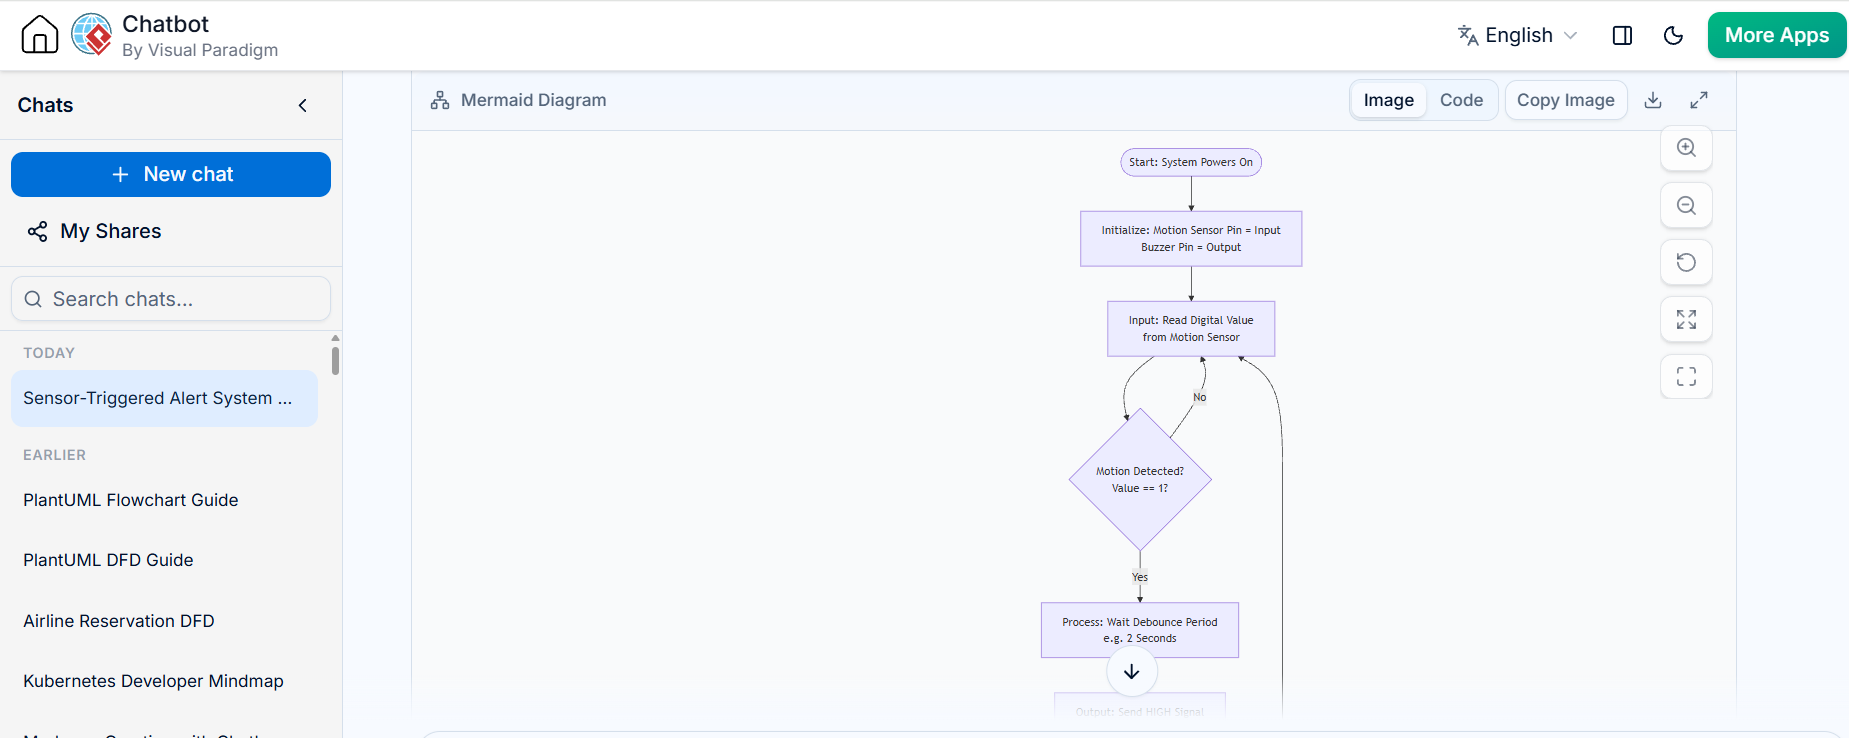
To illustrate the integration of these concepts, consider the logic for a simple security device.
-
Start: The system powers on.
-
Initialize: Set up the motion sensor pin as input and the buzzer pin as output.
-
Input: Read the digital value from the motion sensor (0 or 1).
-
Decision: Has motion been detected? (Is the value == 1?)
-
No: Loop back to step 3 (Continuous monitoring).
-
Yes: Proceed to step 5.
-
-
Process: Wait for a debounce period (e.g., 2 seconds) to avoid false triggers.
-
Output: Send a HIGH signal to the buzzer.
-
Decision: Has the reset button been pressed?
-
No: Keep the buzzer on.
-
Yes: Turn off the buzzer and return to step 3.
-
flowchart TD
    A([Start: System Powers On]) --> B[Initialize: Motion Sensor Pin = Input<br/>Buzzer Pin = Output]
    B --> C[Input: Read Digital Value<br/>from Motion Sensor]
    C --> D{Motion Detected?<br/>Value == 1?}
    D -- No --> C
    D -- Yes --> E[Process: Wait Debounce Period<br/>e.g. 2 Seconds]
    E --> F[Output: Send HIGH Signal<br/>to Buzzer]
    F --> G{Reset Button<br/>Pressed?}
    G -- No --> H[Keep Buzzer On]
    H --> G
    G -- Yes --> I[Turn Off Buzzer]
    I --> C
VP AI Chatbot using PlantUML Code
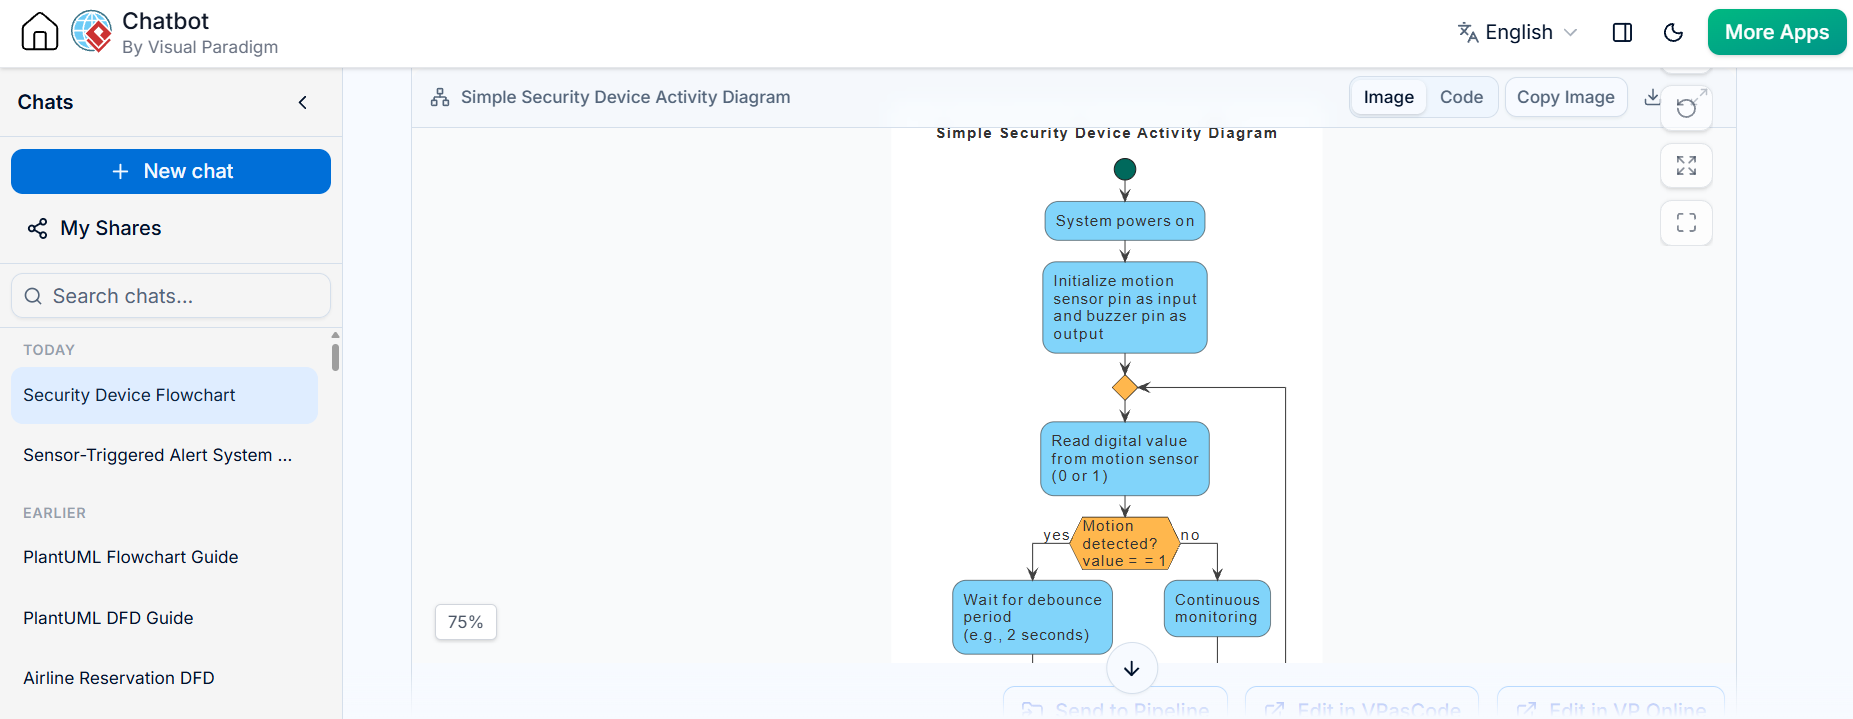
Send to VPasCode for Verification, viewing the Code, Language Translation, etc.
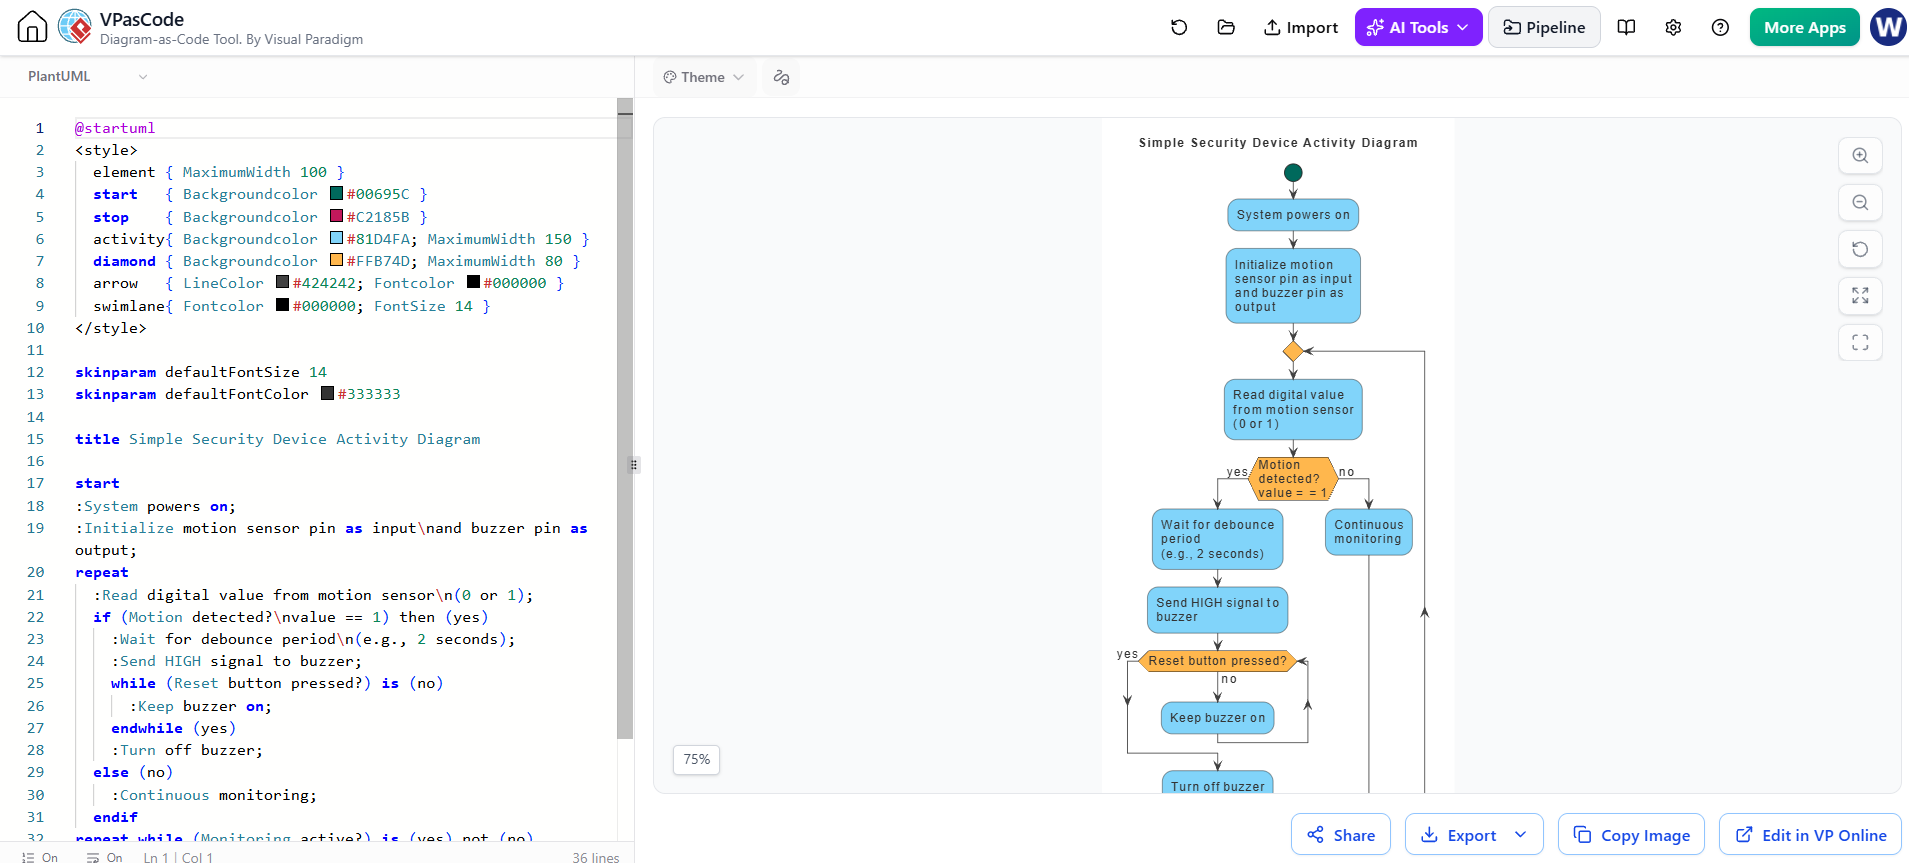
The PlantUML code ready to be edited in the VPasCode Instantly, Click Here!
@startuml
<style>
  element { MaximumWidth 100 }
  start   { Backgroundcolor #00695C }
  stop    { Backgroundcolor #C2185B }
  activity{ Backgroundcolor #81D4FA; MaximumWidth 150 }
  diamond { Backgroundcolor #FFB74D; MaximumWidth 80 }
  arrow   { LineColor #424242; Fontcolor #000000 }
  swimlane{ Fontcolor #000000; FontSize 14 }
</style>

skinparam defaultFontSize 14
skinparam defaultFontColor #333333

title Simple Security Device Activity Diagram

start
:System powers on;
:Initialize motion sensor pin as input\nand buzzer pin as output;
repeat
  :Read digital value from motion sensor\n(0 or 1);
  if (Motion detected?\nvalue == 1) then (yes)
    :Wait for debounce period\n(e.g., 2 seconds);
    :Send HIGH signal to buzzer;
    while (Reset button pressed?) is (no)
      :Keep buzzer on;
    endwhile (yes)
    :Turn off buzzer;
  else (no)
    :Continuous monitoring;
  endif
repeat while (Monitoring active?) is (yes) not (no)
:Power off;
stop
@enduml
Using Visual Paradigm’s AI feature, one could input the above steps as a text prompt, and the tool would generate the corresponding flowchart with a loop back to the “Read Sensor” block and a diamond for the “Motion Detected?” decision . This diagram then serves as the direct reference for writing the microcontroller code (e.g., in C or Python for an Arduino or Raspberry Pi) and wiring the physical components.
Conclusion
Flowcharts are a foundational tool that transforms abstract problem-solving into a tangible, visual plan. They are the critical link between the theoretical understanding of an algorithm and the practical realization of a hardware prototype. By mastering the standardized symbols and logical structures of flowcharts, learners can systematically analyze problems, design efficient algorithms, and document their reasoning. Furthermore, with the advent of AI-assisted diagramming tools like Visual Paradigm, the barrier to creating these models is lower than ever, enabling developers to iterate rapidly from a textual idea to a visual logic map, and finally to a functioning, sensor-driven device. Whether in a classroom learning problem analysis or a workshop building IoT devices, the flowchart remains an indispensable companion in the journey from concept to creation.
Suggested Article Title:
From Logic to Prototype: A Comprehensive Guide to Flowcharts in Problem Analysis and Hardware Development