
The Real Problem Flowcharts Solve
Most flowchart articles start with syntax. That’s backwards. Syntax is the easy part — you’ll forget it in a week and look it up again. The hard part is that a flowchart is a commitment: once it’s in your wiki, it becomes an authority nobody updates. Six months later it’s a beautifully rendered lie.
So the useful framing isn’t “how do I draw a box?” It’s: what kind of diagram earns its maintenance cost?
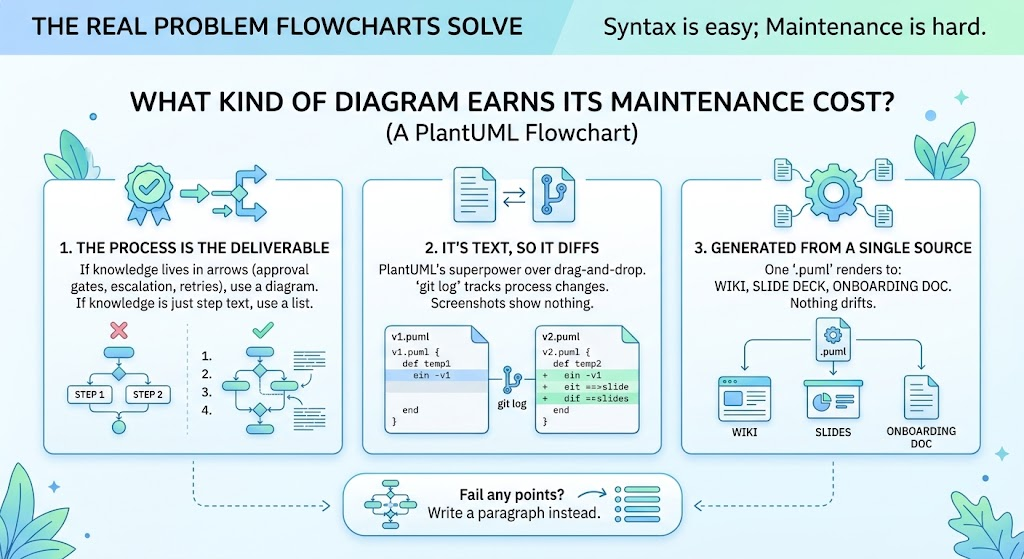
A PlantUML flowchart earns it when three things hold:
-
The process is the deliverable. If the knowledge lives in the arrows (approval gates, escalation paths, retry logic), a diagram beats prose. If it lives in the text of the steps, a numbered list beats a diagram.
-
It’s text, so it diffs. This is PlantUML’s genuine superpower over drag-and-drop tools.
git logon a.pumlfile tells you when the process changed. A screenshot tells you nothing. -
It’s generated from a single source. One
.pumlrenders to the wiki, the slide deck, and the onboarding doc. Nothing drifts.
Fail any of those and you should write a paragraph instead.
PlantUML Doesn’t Have a “Flowchart”
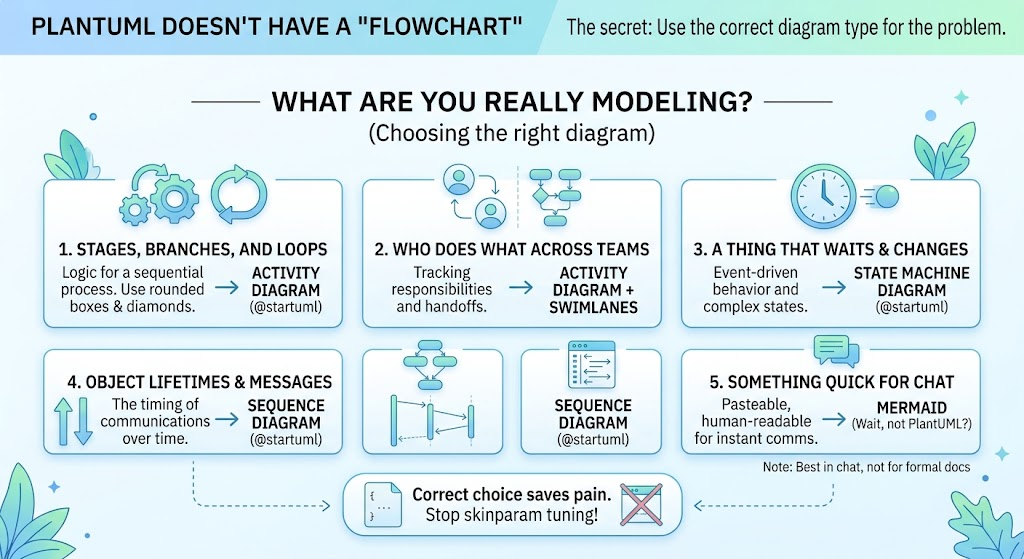
Worth stating plainly, because it trips people up: there is no @startflowchart. What you want is the activity diagram, new (a.k.a. beta/SDL) syntax. It gives you rounded task boxes, condition diamonds, swimlanes, and parallel bars.
| You actually want | Reach for |
|---|---|
| Steps, branches, loops | Activity diagram |
| Who does what across teams | Activity diagram + swimlanes |
| A thing that waits for events and changes state | State machine diagram |
| Object lifetimes over time | Sequence diagram |
| Something you’ll paste into a chat window | Mermaid |
Choosing correctly here saves more pain than any amount of skinparam tuning.
The Mental Model: Three Rules
Everything else is detail.
Rule 1 — It’s a stack. Statements execute top to bottom. You are writing a program that happens to render as geometry. Once you think of it as code, layout weirdness becomes predictable: boxes appear near where you declared them.
Rule 2 — if/else/endif is the only branch. There is no diamond keyword, no decision keyword, no -> step -> chaining. If you find yourself searching for alternatives, you’re fighting the tool.
Rule 3 — Every path must die. stop (or end) terminates a branch. A flow that falls off the bottom of the canvas is not a stylistic choice — it’s an unstated assumption. Audit your leaves.
Syntax Rules That Actually Bite
These are the ones that cost people real debugging time:
-
Semicolon-terminated colon syntax.
:Check stock;— not-> Check stock ->. Forget the trailing;and the parser treats your whole action as a label. -
Comments are
', never//. A stray//silently becomes part of the diagram or breaks it. -
repeatandrepeat whileare a matched pair. One without the other is a parse error, not a warning. -
A literal
;inside your action text ends it early. Reword, or the rest of the line leaks out as garbage. -
Every
ifneeds anendif; every fork branch needs anend fork. Nesting errors surface as bizarre layout, not clear messages. -
stopis mandatory. Well — not strictly mandatory by the parser, but any diagram without it is incomplete by definition.
When a Flowchart Is the Right Answer
Algorithm and control-flow documentation. When the reader’s question is which path do we take, boxes and diamonds win. When it’s what does this step do, they lose.
Troubleshooting trees. “Is the service up? → Is DNS resolving? → Is the cert valid?” This is the archetypal flowchart shape, and it maps perfectly onto runbooks that someone will follow at 3 a.m.
Approval and escalation logic. Thresholds, parallel sign-offs, and rejection loops are genuinely hard to hold in your head as prose.
Test-case derivation. Every distinct start → stop path is a candidate test. Parallel forks flag concurrency risk. This is arguably the most underused application — the diagram is the test matrix.
Onboarding a process owner. A swimlane diagram tells a new team member who hands off to whom faster than any document.
Where It Goes Wrong
When it becomes a picture of a list. If your flowchart is five rectangles in a vertical line with no diamonds, delete it and write a numbered list. You’ve paid rendering cost for zero information gain.
When the diamond hides a condition. “Valid and not expired?” is two decisions compressed into one shape. You have lost a code path, and every reader downstream now believes there are eight paths when there are twelve.
When someone errors on the side of completeness. Yes, you can model all forty steps of the deployment. Nobody will read it. Split at a meaningful boundary — three diagrams of twelve steps beat one of forty.
When it duplicates code instead of explaining it. If the diagram is a transcription of a function body, it will be wrong within a sprint. Diagram the decision structure, link to the code for the details.
Examples
Minimal Branching — the reference shape
@startuml
skinparam defaultFontSize 14
skinparam defaultFontColor #333333
<style>
  element { MaximumWidth 100 }
  start   { Backgroundcolor #00695C }
  stop    { Backgroundcolor #C2185B }
  activity{ Backgroundcolor #81D4FA; MaximumWidth 150 }
  diamond { Backgroundcolor #FFB74D; MaximumWidth 80 }
  arrow   { LineColor #424242; Fontcolor #000000 }
  swimlane{ Fontcolor #000000; FontSize 14 }
</style>
title Password Reset Activity Diagram

start
:Enter registered email;
:Look up account;
if (Account found?) then (yes)
  :Generate reset token;
  :Send reset link;
  :User clicks link within 15 min;
  if (Link valid?) then (yes)
    :Set new password;
    :Invalidate old sessions;
    stop
  else (no)
    :Show "link expired";
    stop
  endif
else (no)
  :Show generic confirmation;
  :Log attempt for security;
  stop
endif

@enduml
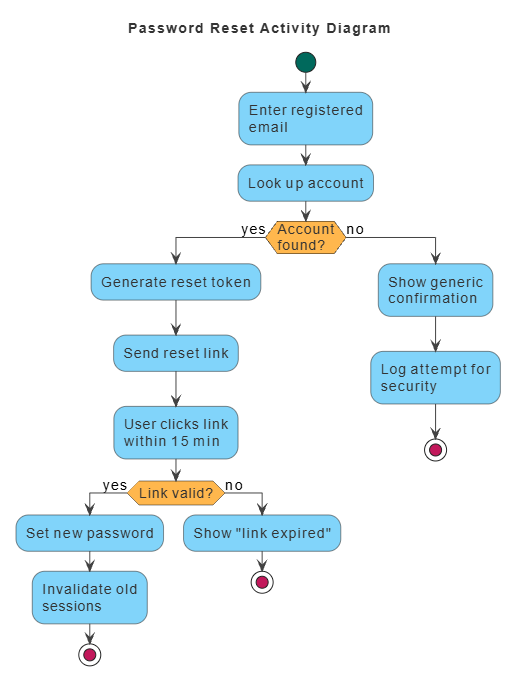
Note the deliberate asymmetry: the “account not found” branch still does two things. That’s a real design decision — the response is identical to a successful request, and the difference only shows up in the audit log. A prose description would almost certainly have dropped this detail.
Loop Then Parallel Work
@startuml
skinparam defaultFontSize 14
skinparam defaultFontColor #333333
<style>
  element { MaximumWidth 100 }
  start   { Backgroundcolor #00695C }
  stop    { Backgroundcolor #C2185B }
  activity{ Backgroundcolor #81D4FA; MaximumWidth 150 }
  diamond { Backgroundcolor #FFB74D; MaximumWidth 80 }
  arrow   { LineColor #424242; Fontcolor #000000 }
  swimlane{ Fontcolor #000000; FontSize 14 }
</style>
title Data Ingest and Publish Activity Diagram

start
:Fetch batch from source;
repeat
  :Parse next record;
  if (Record valid?) then (yes)
    :Stage record;
  else (no)
    :Append to reject log;
  endif
repeat while (More records?) is (yes) not (no)

fork
  :Build publish payload;
fork again
  :Update ingest metrics;
fork again
  :Archive source batch;
end fork

:Publish payload to consumers;
if (Publish succeeded?) then (yes)
  :Mark batch complete;
  stop
else (no)
  :Flag batch for retry;
  stop
endif

@enduml
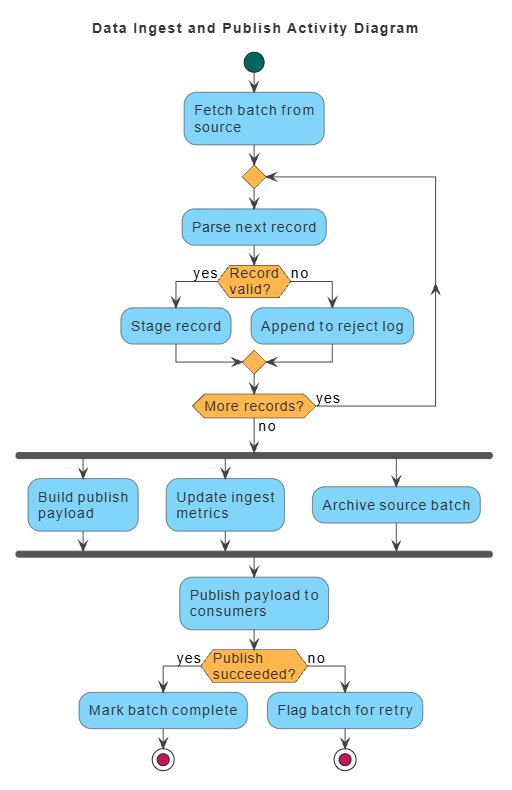
The fork block is doing real work here: it asserts that metrics and archiving happen regardless of publish outcome, and concurrently. Written as three sequential boxes, a reader would reasonably assume ordering matters. That’s the kind of thing diagrams are uniquely good at.
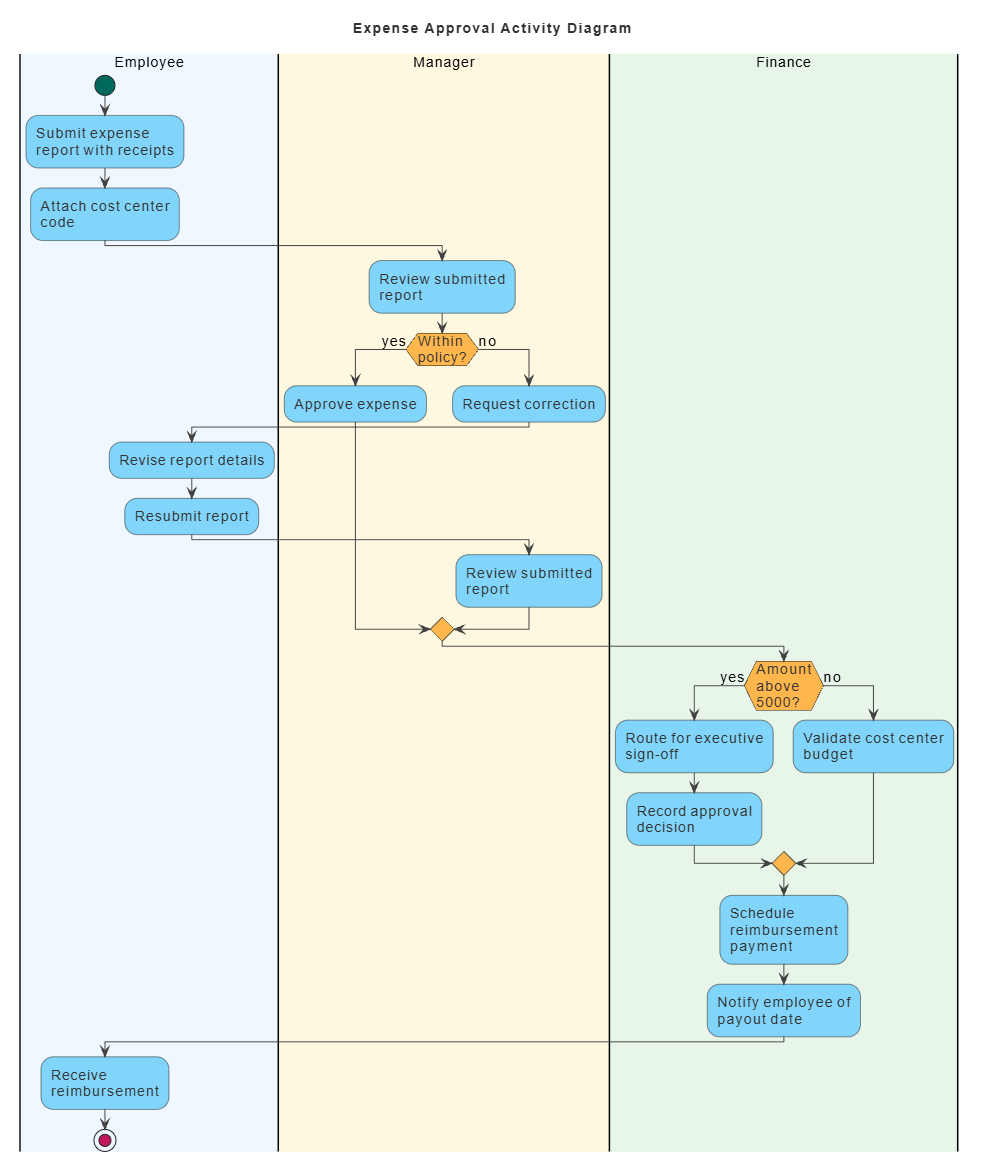
Swimlanes — Accountability Over Phase
@startuml
skinparam defaultFontSize 14
skinparam defaultFontColor #333333
<style>
  element { MaximumWidth 100 }
  start   { Backgroundcolor #00695C }
  stop    { Backgroundcolor #C2185B }
  activity{ Backgroundcolor #81D4FA; MaximumWidth 150 }
  diamond { Backgroundcolor #FFB74D; MaximumWidth 80 }
  arrow   { LineColor #424242; Fontcolor #000000 }
  swimlane{ Fontcolor #000000; FontSize 14 }
</style>
title Expense Approval Activity Diagram

|#F0F8FF|Employee|
start
:Submit expense report with receipts;
:Attach cost center code;

|#FFF8E1|Manager|
:Review submitted report;
if (Within policy?) then (yes)
  :Approve expense;
else (no)
  :Request correction;
  |#F0F8FF|Employee|
  :Revise report details;
  :Resubmit report;
  |#FFF8E1|Manager|
  :Review submitted report;
endif

|#E8F5E9|Finance|
if (Amount above 5000?) then (yes)
  :Route for executive sign-off;
  :Record approval decision;
else (no)
  :Validate cost center budget;
endif
:Schedule reimbursement payment;
:Notify employee of payout date;

|#F0F8FF|Employee|
:Receive reimbursement;
stop

@enduml
Swimlanes answer who. Partitions answer when. Mixing both in one canvas is where diagrams collapse under their own weight — pick the axis your reader cares about.
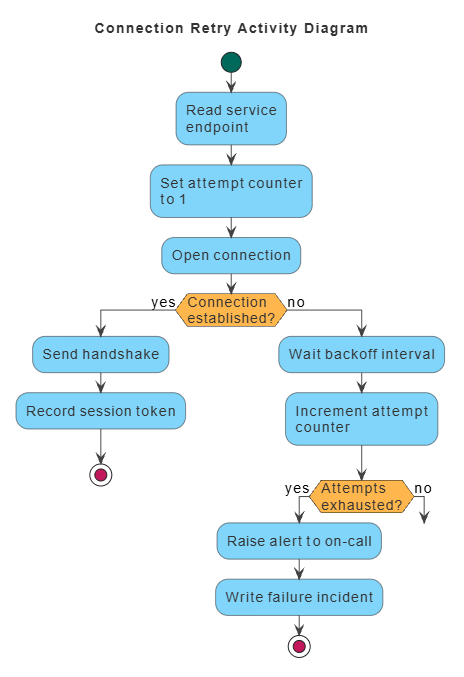
Named Connectors for Retry — Runbook Style
@startuml
skinparam defaultFontSize 14
skinparam defaultFontColor #333333
<style>
  element { MaximumWidth 100 }
  start   { Backgroundcolor #00695C }
  stop    { Backgroundcolor #C2185B }
  activity{ Backgroundcolor #81D4FA; MaximumWidth 150 }
  diamond { Backgroundcolor #FFB74D; MaximumWidth 80 }
  arrow   { LineColor #424242; Fontcolor #000000 }
  swimlane{ Fontcolor #000000; FontSize 14 }
</style>
title Connection Retry Activity Diagram

start
:Read service endpoint;
:Set attempt counter to 1;
label retryStart
:Open connection;
if (Connection established?) then (yes)
  :Send handshake;
  :Record session token;
  stop
else (no)
  :Wait backoff interval;
  :Increment attempt counter;
  if (Attempts exhausted?) then (yes)
    :Raise alert to on-call;
    :Write failure incident;
    stop
  else (no)
    goto retryStart
  endif
endif

@enduml
Long curved back-edges are the single biggest readability killer in flowcharts. A labeled connector reads like a real procedure — “go back to retryStart” — which is exactly how the operator thinks about it.
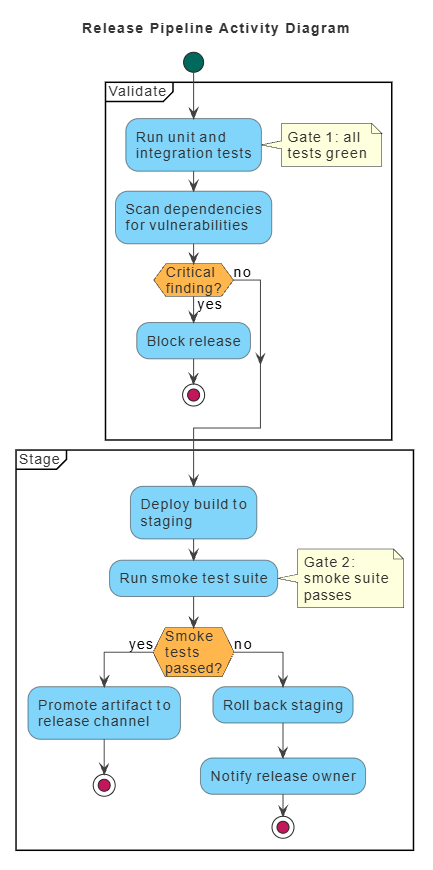
Partitions With Gate Notes
@startuml
skinparam defaultFontSize 14
skinparam defaultFontColor #333333
<style>
  element { MaximumWidth 100 }
  start   { Backgroundcolor #00695C }
  stop    { Backgroundcolor #C2185B }
  activity{ Backgroundcolor #81D4FA; MaximumWidth 150 }
  diamond { Backgroundcolor #FFB74D; MaximumWidth 80 }
  arrow   { LineColor #424242; Fontcolor #000000 }
  swimlane{ Fontcolor #000000; FontSize 14 }
</style>
title Release Pipeline Activity Diagram

start
partition "Validate" {
  :Run unit and integration tests;
  note right: Gate 1: all tests green
  :Scan dependencies for vulnerabilities;
  if (Critical finding?) then (yes)
    :Block release;
    stop
  else (no)
  endif
}

partition "Stage" {
  :Deploy build to staging;
  :Run smoke test suite;
  note right: Gate 2: smoke suite passes
  if (Smoke tests passed?) then (yes)
    :Promote artifact to release channel;
    stop
  else (no)
    :Roll back staging;
    :Notify release owner;
    stop
  endif
}

@enduml
Cheatsheet
start
:Action text;
if (Condition?) then (yes)
  :Yes path;
elseif (Other condition?) then (maybe)
  :Maybe path;
else (no)
  :No path;
endif

while (Condition?) is (yes)
  :Loop body;
endwhile

repeat
  :Loop body;
repeat while (Continue?) is (loop) not (done)

fork
  :Branch A;
fork again
  :Branch B;
end fork

|#E3F2FD|Lane One|
:Task in lane one;
|#FFF3E0|Lane Two|
:Task in lane two;

partition "Phase Name" {
  :Grouped task;
}

note right: Annotation text
goto labelName
labelName :Target action;
stop
Habits That Keep Diagrams Alive
Bound the width, not the count. MaximumWidth 150 on activities forces wrapping instead of ballooning the canvas. Then you can afford more boxes before things get ugly.
One question per diamond, always. “Valid and not expired?” is a bug. Split it. You’ll find paths you didn’t know existed.
Label arrows, not shapes. then (yes) / else (no) puts the answer where the eye already is. The diamond holds only the question.
Every leaf gets a stop. Then grep for stop and count — it should match your mental path count. Mismatch means an undocumented exit.
Split by audience, not by step count. A diagram for the on-call engineer and one for the compliance auditor share almost no content. Don’t compromise on a single canvas.
Annotate gates, not every box. A note right: on the two places where a human must decide is high-signal. A note on every box is wallpaper.
Version it. The .puml goes in the repo next to the code it describes. That’s the whole reason to use a text format — don’t throw it away by pasting a PNG into Confluence.
Recommended Tooling Stack
To bridge the gap between high-level business process design and developer-centric workflows, modern teams leverage an integrated ecosystem combining visual layout engines, generative AI automation, and text-based diagramming.
1. Visual Paradigm Flowchart Engine
Visual Paradigm provides a robust, enterprise-grade environment for modeling workflows, decision logic, and operational pipelines.
-
Professional Standards: Utilizes standard flowchart and BPMN symbols to maintain compliance and readability.
-
Deep Traceability: Connects flowchart shapes directly to system requirements, UML components, and architectural models, eliminating isolated documentation silos.
2. Generative AI Integration
Visual Paradigm’s built-in AI features automate the heavy lifting of initial diagram creation and refinement:
-
Text-to-Workflow Translation: Instantly converts natural language prompts (e.g., “Model an automated customer support escalation process”) into fully structured, editable visual nodes.
-
Smart Diagnostics & Translation: Automatically catches layout inconsistencies, suggests optimization steps, and translates text labels across multiple languages for global collaboration.
3. VPasCode Tool (Diagram-as-Code)
For technical architects and developers who prefer writing code over manual shape positioning, VPasCode serves as Visual Paradigm’s dedicated browser-based diagram-as-code platform.
-
Multi-Engine Support: Native compatibility with popular text-based modeling formats including Mermaid.js, PlantUML, and Graphviz.
-
AI Error Correction & Live Preview: Renders text scripts into production-ready vector diagrams in real time while using integrated AI to auto-fix syntax errors or generate complete architectures from scratch.
Tool Comparison Matrix
| Tool Component | Primary Focus | Best Suited For |
|---|---|---|
| Visual Paradigm Flowchart | Drag-and-drop precision, swimlanes, and enterprise modeling | Business Analysts & Project Managers |
| Visual Paradigm AI | Natural language text-to-diagram automation | Rapid prototyping and cross-team drafting |
| VPasCode Tool | Text-to-diagram generation via Mermaid & PlantUML | Software Engineers & Technical Architects |