


Understanding how information moves through a system is critical for building robust software and efficient business processes. Data Flow Diagrams (DFDs) provide a visual representation of this movement. They map out the flow of data from external sources to internal processes, showing where data is stored and how it is transformed. However, drawing a single diagram rarely captures the complexity of modern systems. This is where the hierarchy of Level 0, Level 1, and Level 2 DFDs becomes essential.
Choosing the right level of detail at the right time prevents confusion during requirements gathering and system design. This guide explores the specific applications, components, and rules for each level. We will examine when to stop decomposing a process and how to maintain consistency across your documentation.
🔍 What is a Data Flow Diagram?
A Data Flow Diagram is a graphical representation of the flow of data through an information system. Unlike flowcharts, which focus on control flow and logic decisions, DFDs focus on data movement. They help stakeholders visualize how inputs are converted into outputs.
- Process: An action that transforms data.
- Data Store: Where data rests for later use.
- External Entity: A source or destination outside the system boundary.
- Data Flow: The movement of data between these components.
By breaking down a system into specific levels, analysts can manage complexity. You do not need to show every single transaction detail on the first diagram. Instead, you start broad and refine as needed.
🌍 Level 0: The Context Diagram 🌍
The Level 0 DFD is often referred to as the Context Diagram. It represents the entire system as a single process. This high-level view establishes the boundary between the system and its environment.
🎯 When to Use Level 0
- Requirements Gathering: Use this early to confirm the scope with stakeholders.
- Project Kickoff: Provides a quick overview for new team members.
- System Boundary Definition: Clearly defines what is inside the system and what is outside.
⚙️ Key Components
- One Process Node: The entire system is represented by a single circle or rounded rectangle. It is usually labeled with the system name (e.g., “Order Processing System”).
- External Entities: These are people, organizations, or other systems that interact with your system. Examples include “Customer,” “Payment Gateway,” or “Warehouse Management System.”
- Note: Do not include internal departments as external entities if they are part of the same system scope.
- Data Flows: Arrows showing input and output between entities and the central process.
📝 Example Scenario
Consider a library management system. The Level 0 diagram would show the central “Library System” process. External entities would include “Librarian,” “Member,” and “Book Supplier.” Data flows would include “New Book Request” from the supplier and “Book Checkout” from the member.
This level answers the question: “What is the system, and who talks to it?”
🔄 Level 1: The High-Level Process Map 🔄
Level 1 DFD expands the single process from Level 0 into its major sub-processes. It reveals the internal workings of the system without getting bogged down in minute details. This is often the most important diagram for high-level architecture discussions.
🎯 When to Use Level 1
- System Design Phase: Developers need to know the major modules.
- Feature Planning: Product managers use this to identify distinct functional areas.
- Interface Definition: Helps identify where data enters and leaves the system to define APIs.
⚙️ Key Components
- Major Processes: Decompose the single Level 0 process into 5 to 9 distinct processes. If you have more, consider grouping them further.
- Data Stores: Level 1 is where you typically introduce data stores (databases, files, tables). This shows where information persists.
- Consistency: Every data flow entering or leaving the system in Level 0 must appear in Level 1. This is known as Balancing.
📝 Example Scenario
Continuing with the library system, the Level 1 diagram breaks “Library System” into “Register Member,” “Check Out Book,” “Process Fines,” and “Manage Inventory.” Data stores might include “Member Database” and “Book Catalog.” The flow of “Book Checkout” from Level 0 splits into flows interacting with the “Member Database” and “Book Catalog” in Level 1.
This level answers the question: “What are the main functions, and where is data stored?”
🔬 Level 2: The Detailed Process View 🔬
Level 2 DFDs dive deeper into specific processes identified in Level 1. A single Level 1 process might be too complex to understand fully, so it is decomposed further. Not every process needs a Level 2 diagram; only those that require detailed specification.
🎯 When to Use Level 2
- Detailed Specification: Used when writing technical requirements for developers.
- Complex Logic: Processes involving multiple decision points or calculations.
- Legacy Modernization: Mapping existing complex workflows to new systems.
⚙️ Key Components
- Sub-Processes: Breakdown of Level 1 processes. For example, “Check Out Book” becomes “Validate Member,” “Update Inventory,” and “Generate Receipt.”
- Limit the number of sub-processes to avoid clutter.
- Input/Output Detail: Show exactly what data elements are passed between these sub-processes.
- Control Logic: While DFDs do not show logic like code, Level 2 often hints at decision points (e.g., “If Member Valid, Proceed”).
📝 Example Scenario
In the library example, the “Process Fines” process from Level 1 is broken down. It might show “Calculate Overdue Days,” “Apply Fee Rate,” and “Update Account Balance.” This level ensures that the logic for calculating fines is clear and consistent with business rules.
This level answers the question: “How exactly does this specific function work?”
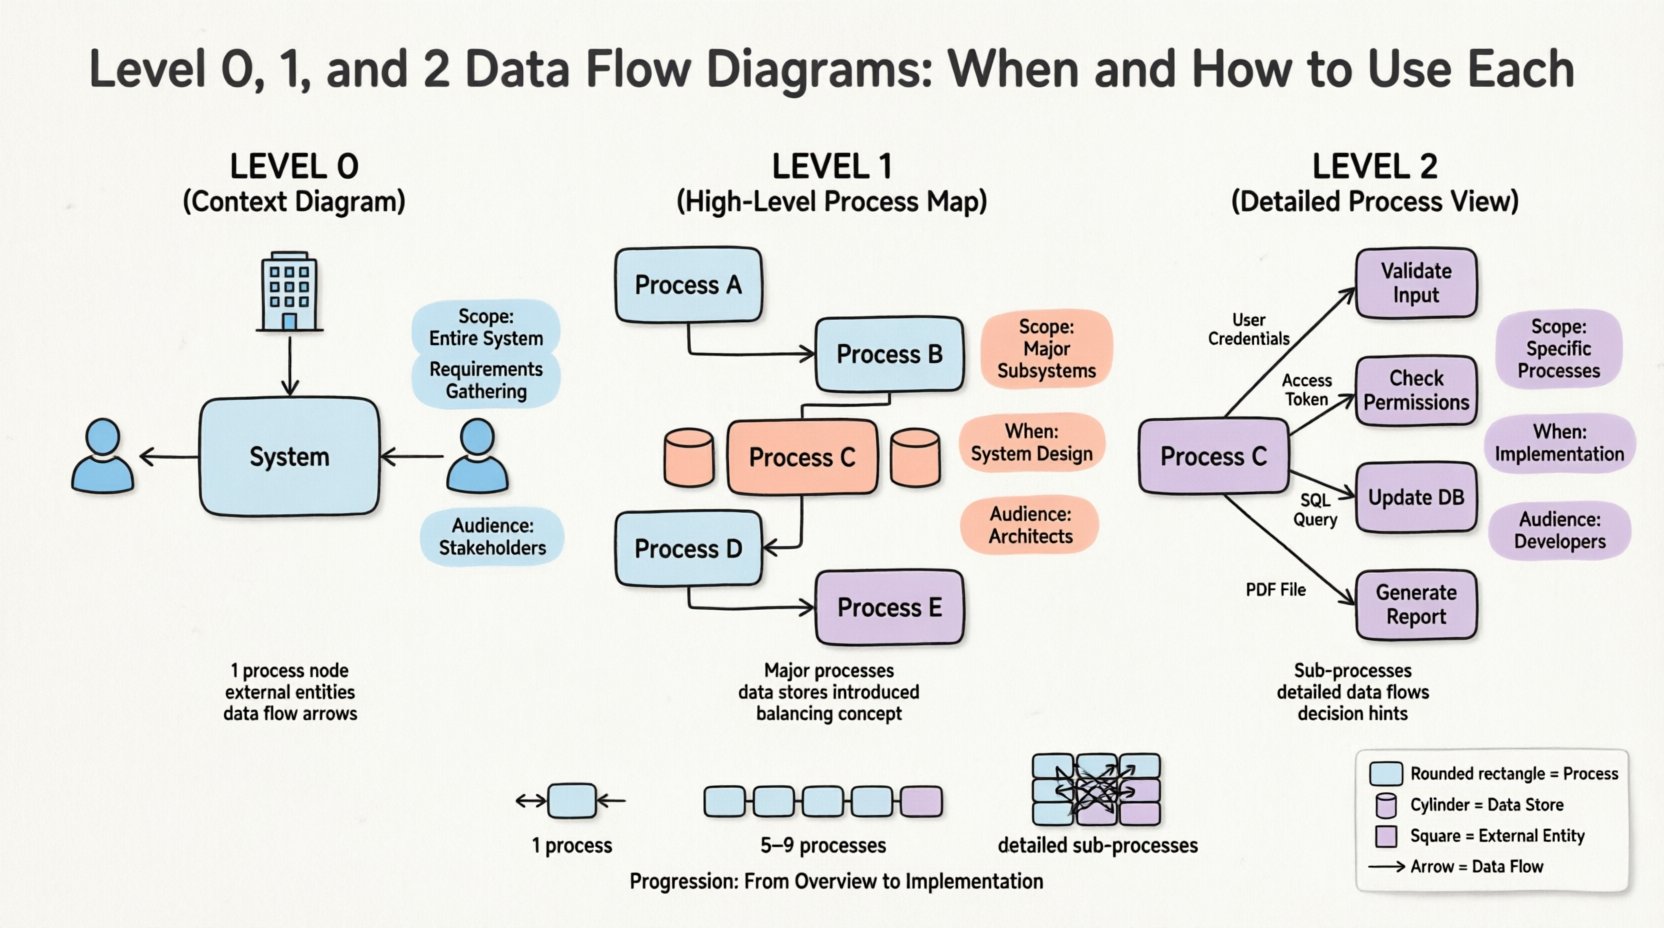
📊 Comparison of DFD Levels
| Feature | Level 0 (Context) | Level 1 (High-Level) | Level 2 (Detailed) |
|---|---|---|---|
| Scope | Entire System | Major Subsystems | Specific Processes |
| Process Count | 1 | 5 to 9 | Variable (Deep Dive) |
| Data Stores | None | Major Stores | Detailed Storage |
| Audience | Stakeholders, Executives | Architects, Managers | Developers, Analysts |
| Timing | Requirements Phase | Design Phase | Implementation Phase |
| Focus | Boundaries | Functionality | Logic & Data |
🛠️ Best Practices for DFD Modeling
Creating accurate diagrams requires discipline. Adhering to specific rules ensures that your documentation remains useful throughout the project lifecycle.
1. Maintain Balancing
When you decompose a process from Level 0 to Level 1, the inputs and outputs must match. If Level 0 shows “User Login Request” entering the system, Level 1 must show that same data entering the “Authentication Process.” If data disappears or appears out of nowhere, the diagram is invalid.
2. Naming Conventions
- Processes: Use a Verb-Noun structure (e.g., “Validate Order,” not “Order Validation”). This emphasizes action.
- Data Flows: Use Noun phrases (e.g., “Customer Data,” “Invoice”).
- Entities: Use singular nouns (e.g., “Customer,” not “Customers”).
3. Avoid Data Spaghetti
Do not draw data flows that cross over each other excessively. If a diagram becomes a web of lines, it is likely too complex. Consider breaking a Level 1 process into separate diagrams.
4. No Cross-Talk
External entities should not communicate directly with each other. All communication must pass through the system process. If the “Warehouse” sends data to the “Billing System,” it must go through the “Order Processing” process.
5. Limit Data Stores
Too many data stores confuse the reader. Only include stores that are necessary for the current level of detail. If a store is only used in Level 2, it might not need to appear in Level 1.
🚫 Common Pitfalls to Avoid
Even experienced analysts make mistakes. Recognizing these errors early saves time during reviews.
- Black Holes: A process with no output. This implies data is disappearing, which is logically impossible in a functioning system.
- Miracles: A process with no input. Data cannot be created from nothing.
- Gray Holes: A process that has inputs but produces different outputs than expected based on the input. This usually indicates missing logic.
- Too Much Detail Too Soon: Drawing Level 2 diagrams before Level 1 is approved leads to rework. Stick to the hierarchy.
- Ignoring Data Stores: Failing to show where data is saved makes the system look transient and unreliable.
📋 Implementation Strategy
How should you approach creating these diagrams for a new project? Follow this structured workflow.
Phase 1: Scope Definition
Start with the Level 0 diagram. Identify the system name and all external entities. Do not worry about internal processes yet. Get sign-off from the project sponsor on the boundary.
Phase 2: Functional Decomposition
Create the Level 1 diagram. Identify the major processes. Ensure all data stores are defined. Verify that the data flows from Level 0 are present here. This is where the architecture takes shape.
Phase 3: Detailed Logic
Select complex processes from Level 1 that need clarification. Create Level 2 diagrams for these specific areas. Use this for developer handoffs and unit testing specifications.
Phase 4: Maintenance
DFDs are not static. When the system changes, update the diagrams. A DFD that is outdated is worse than no DFD at all. Establish a rule that diagrams must be updated with every release cycle.
🤝 Integration with Other Techniques
DFDs do not exist in a vacuum. They work best when combined with other modeling methods.
- Entity-Relationship Diagrams (ERD): DFDs show movement; ERDs show structure. Use ERDs to define the data stores shown in your DFDs.
- Use Case Diagrams: Use Case diagrams focus on user interaction. DFDs focus on data. They complement each other in requirements documentation.
- Sequence Diagrams: Sequence diagrams show timing. DFDs show structure. Use Sequence diagrams to clarify the timing of data flows in Level 2 processes.
📝 Summary of Usage
Selecting the correct DFD level depends on the audience and the goal of the documentation.
- Use Level 0 to define boundaries and scope.
- Use Level 1 to define architecture and major functions.
- Use Level 2 to define logic and implementation details.
By maintaining strict adherence to the rules of decomposition and balancing, you create a clear roadmap for system development. This clarity reduces miscommunication between business stakeholders and technical teams. Remember that the goal is not just to draw pictures, but to ensure a shared understanding of how data serves the business.
Invest time in getting the hierarchy right. A well-structured set of Data Flow Diagrams pays dividends during the development and maintenance phases of any software project.