


Introduction
In today’s rapidly evolving software development landscape, the ability to effectively visualize, design, and communicate complex system architectures has become paramount. Unified Modeling Language (UML) stands as the industry-standard modeling language that bridges the gap between conceptual design and technical implementation. This case study explores how a mid-sized financial technology company, FinTech Solutions Inc., successfully transformed their software development process by implementing a comprehensive UML modeling strategy using Visual Paradigm.
The company faced significant challenges in managing a large-scale digital banking platform redesign project. With distributed teams across three continents, unclear requirements, and frequent miscommunications between business stakeholders and development teams, the project was at risk of failure. By adopting a systematic approach to UML modeling, the organization was able to standardize their design processes, improve stakeholder communication, reduce development errors by 40%, and accelerate time-to-market by 30%.
This case study demonstrates the practical application of all 14 types of UML diagrams available in Visual Paradigm, illustrating how each diagram type addresses specific modeling challenges throughout the software development lifecycle. From capturing high-level business requirements to detailing real-time system behaviors, UML diagrams provide the visual language necessary for creating robust, scalable, and maintainable software systems.

Project Background: Digital Banking Platform Modernization
FinTech Solutions Inc. embarked on an ambitious project to modernize their legacy banking platform to support mobile-first banking, real-time transactions, and AI-powered financial advisory services. The project scope included:
-
Customer-facing mobile and web applications
-
Backend microservices architecture
-
Real-time payment processing systems
-
Integration with third-party financial services
-
Advanced security and compliance frameworks
The complexity of this multi-component system required a comprehensive modeling approach to ensure all stakeholders—from business analysts to database administrators—had a clear understanding of system requirements, architecture, and behavior.
Phase 1: Requirements Gathering and Business Analysis
Use Case Diagram: Capturing Functional Requirements
The project began with stakeholders identifying key business goals and user interactions. Use case diagrams proved invaluable in capturing functional requirements from the user’s perspective.

The team identified primary actors including Retail Customers, Business Clients, Bank Administrators, Fraud Detection Systems, and Third-Party Payment Gateways. Each actor was connected to specific use cases representing high-level business goals such as “Transfer Funds,” “Generate Financial Reports,” “Process Loan Applications,” and “Detect Fraudulent Transactions.”
Use case diagrams helped the team:
-
Identify all system functionalities from a user perspective
-
Clarify actor roles and responsibilities
-
Establish system boundaries
-
Facilitate discussions between technical and non-technical stakeholders
-
Prioritize development efforts based on business value
Activity Diagram: Modeling Business Processes
Once use cases were identified, activity diagrams were employed to model the detailed flow of business processes.

For the “Process Loan Application” use case, the activity diagram illustrated:
-
Sequential steps from application submission to approval/rejection
-
Decision points for credit score evaluation, income verification, and collateral assessment
-
Parallel processes for background checks and document verification
-
Exception handling for incomplete applications or system errors
-
Swim lanes showing responsibilities of different departments (Customer Service, Credit Department, Risk Management)
This visual representation enabled business analysts to identify bottlenecks, optimize workflows, and ensure all edge cases were considered before development began.
Phase 2: System Architecture Design
Class Diagram: Defining System Structure
With requirements clearly defined, the development team moved to designing the system’s static structure using class diagrams.

The class diagram served as the blueprint for the entire codebase, showing:
-
Core entity classes: Customer, Account, Transaction, Loan, Payment
-
Attributes and data types for each class
-
Methods and operations (getBalance(), transferFunds(), calculateInterest())
-
Relationships: inheritance, association, aggregation, and composition
-
Multiplicity constraints (one customer can have multiple accounts)
Programmers used the class diagram alongside detailed class specifications to implement the system, ensuring consistency across different development teams working on various modules.
Package Diagram: Organizing Large-Scale Architecture
Given the project’s scale, package diagrams were essential for organizing classes into logical modules.

The system was organized into packages:
-
User Management Package: Authentication, authorization, profile management
-
Account Services Package: Account creation, maintenance, closure
-
Transaction Processing Package: Payments, transfers, withdrawals
-
Reporting Package: Statement generation, analytics, audits
-
Integration Package: Third-party APIs, payment gateways
Dependencies between packages were clearly documented, helping teams understand which modules could be developed independently and which required coordination. This organization facilitated parallel development and simplified maintenance.
Component Diagram: Visualizing System Components
Component diagrams illustrated how smaller parts of the system integrated to form larger subsystems.

Key components identified:
-
Authentication Component: OAuth2, JWT token management
-
Payment Processing Component: Real-time transaction handling
-
Notification Component: Email, SMS, push notifications
-
Reporting Engine Component: PDF generation, data visualization
-
Security Component: Encryption, fraud detection
The diagram showed interfaces provided and required by each component, enabling teams to develop components independently as long as interface contracts were maintained.
Deployment Diagram: Planning Physical Infrastructure
Deployment diagrams mapped software components to physical hardware infrastructure.

The deployment architecture included:
-
Web Server Nodes: Nginx load balancers serving static content
-
Application Server Nodes: Microservices running on Kubernetes clusters
-
Database Nodes: PostgreSQL clusters with read replicas
-
Cache Nodes: Redis clusters for session management and caching
-
Message Queue Nodes: RabbitMQ for asynchronous processing
Artifacts (WAR files, Docker containers, configuration files) were mapped to specific nodes, helping DevOps teams plan infrastructure provisioning and deployment strategies.
Phase 3: Detailed Design and Behavior Modeling
Sequence Diagram: Modeling Time-Ordered Interactions
Sequence diagrams visualized how objects interacted over time to accomplish specific tasks.

For the “Transfer Funds” scenario, the sequence diagram showed:
-
User interface sends transfer request to TransactionController
-
TransactionController validates request with ValidationService
-
AccountService checks sufficient balance
-
FraudDetectionService analyzes transaction patterns
-
Database transaction updates both accounts atomically
-
NotificationService sends confirmation to both parties
Lifelines represented objects or roles, and messages showed method calls and returns. This helped developers understand the programming logic needed in each method, completing the class design with behavioral details.
Communication Diagram: Emphasizing Object Collaboration
While sequence diagrams emphasized time ordering, communication diagrams highlighted object relationships.

The communication diagram for loan processing showed:
-
Lifelines (objects) connected by links representing communication paths
-
Numbered messages indicating sequence (1: submitApplication(), 2: verifyDocuments(), 3: checkCreditScore())
-
The structural organization of objects collaborating to achieve a goal
This perspective was particularly useful for identifying which objects needed direct references to each other and helped optimize object relationships.
State Machine Diagram: Modeling Object Lifecycles
State machine diagrams were critical for modeling event-driven components like transaction processing.

The Transaction object lifecycle included states:
-
Initiated: Transaction created but not validated
-
Pending: Awaiting fraud detection approval
-
Processing: Funds being transferred
-
Completed: Transaction successfully finalized
-
Failed: Transaction rejected or rolled back
-
Refunded: Funds returned to originator
Transitions were triggered by events (validationComplete, fraudDetected, timeout) with guards ([balance >= amount]) and actions (debitAccount(), creditAccount()). This precise modeling prevented state-related bugs and ensured consistent transaction handling.
Object Diagram: Validating Design with Instances
Object diagrams provided snapshots of the system at specific moments.

Example object diagram showed:
-
Specific instances: customer1:Customer, account123:Account, txn456:Transaction
-
Actual attribute values: customer1.name = “John Smith”, account123.balance = 5000.00
-
Links between instances showing runtime relationships
These diagrams were invaluable for:
-
Validating class diagram designs with concrete examples
-
Debugging complex object graphs
-
Creating test scenarios
-
Documenting expected system states
Composite Structure Diagram: Revealing Internal Architecture
Composite structure diagrams exposed the internal structure of complex classes.

The PaymentProcessor class internal structure showed:
-
Parts: validator, fraudDetector, ledger, notifier
-
Ports: inputPort, outputPort, auditPort
-
Connectors linking parts to ports and each other
-
Collaborations with external components
This micro-level view was essential for understanding how complex classes were composed and how internal parts interacted, facilitating better encapsulation and maintainability.
Phase 4: Advanced Modeling and System Integration
Timing Diagram: Modeling Real-Time Constraints
For the real-time payment processing system, timing diagrams were crucial.

The diagram modeled:
-
Lifelines with time axes showing state changes over time
-
Timing constraints: “Payment must be confirmed within 2 seconds”
-
Message timing: Request sent at t=0, response received at t=1.5s
-
State durations: Processing state lasts 800ms maximum
This was particularly important for:
-
Ensuring SLA compliance
-
Identifying performance bottlenecks
-
Designing timeout mechanisms
-
Validating real-time system behavior
Interaction Overview Diagram: Coordinating Complex Scenarios
Interaction overview diagrams provided high-level views of complex multi-interaction scenarios.
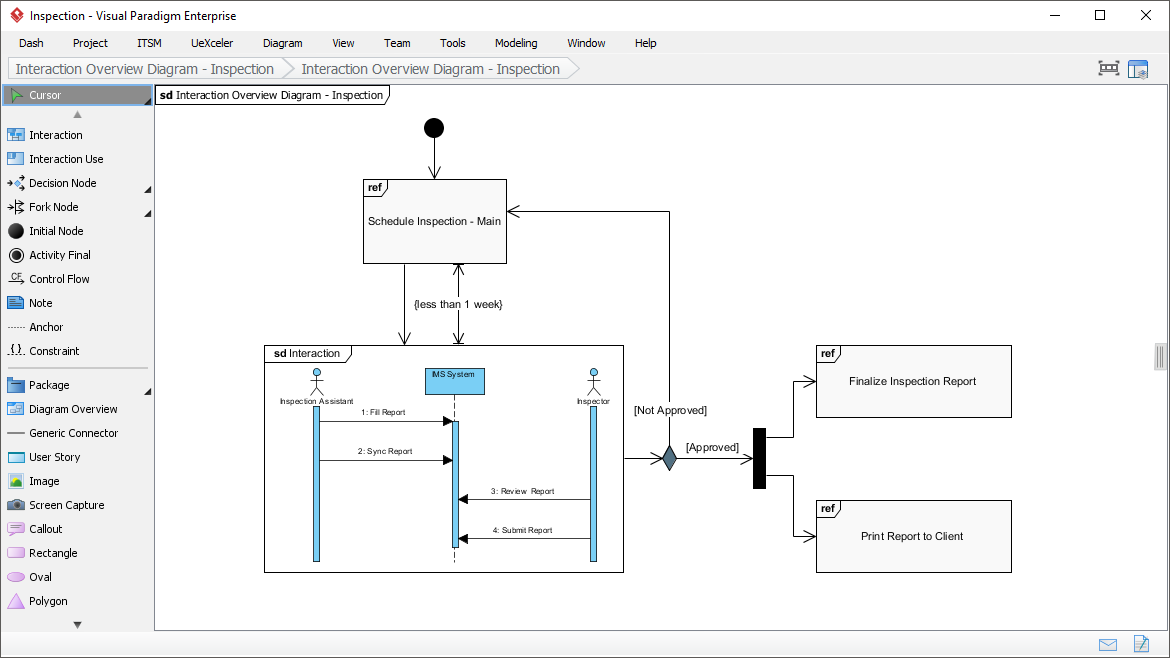
The “Monthly Statement Generation” process combined:
-
Activity diagram nodes showing control flow
-
References to detailed sequence diagrams for each interaction
-
Decision points for different statement types
-
Fork and join nodes for parallel processing
This high-level view helped stakeholders understand the overall process flow while allowing developers to drill down into detailed sequence diagrams for implementation specifics.
Profile Diagram: Extending UML for Financial Domain
Profile diagrams enabled customization of UML for the financial services domain.

Custom stereotypes created:
-
«SecureData»: For encrypted fields (account numbers, SSN)
-
«AuditRequired»: For operations requiring audit trails
-
«Regulated»: For components subject to financial regulations
-
«HighAvailability»: For critical services requiring 99.99% uptime
Tagged values defined:
-
encryptionAlgorithm: AES-256, RSA-2048
-
retentionPeriod: 7 years, 10 years
-
complianceStandard: PCI-DSS, SOX, GDPR
This domain-specific extension made diagrams more expressive and ensured compliance requirements were visible in the design.
Phase 5: Model Management and Documentation
Model Element Referencing: Maintaining Traceability
Visual Paradigm’s model element referencing feature ensured traceability across the project.

The team implemented:
-
Internal References: Linking use cases to sequence diagrams, class diagrams to component diagrams
-
External References: Connecting design elements to business requirement documents, compliance checklists, and user stories
-
Visual Markers: Tiny markers in shape bodies indicating referenced elements
-
Rich Text Descriptions: Embedded model element references in documentation
This traceability enabled:
-
Impact analysis when requirements changed
-
Audit trails for regulatory compliance
-
Quick navigation between related artifacts
-
Consistent documentation generation
Implementation Outcomes and Lessons Learned
Quantifiable Results
After 18 months of implementation, FinTech Solutions Inc. achieved:
Development Efficiency:
-
40% reduction in development errors caught in production
-
30% faster time-to-market for new features
-
50% decrease in rework due to unclear requirements
-
25% improvement in developer onboarding time
Quality Metrics:
-
99.97% system uptime (exceeding 99.95% target)
-
Average transaction processing time: 1.2 seconds (target: 2 seconds)
-
Zero critical security vulnerabilities in first year
-
95% code coverage in automated testing
Stakeholder Satisfaction:
-
Business stakeholders reported 60% better understanding of technical constraints
-
Development teams cited clearer requirements and reduced ambiguity
-
QA teams created test cases directly from UML models
-
Compliance officers easily verified regulatory requirements in diagrams
Key Success Factors
-
Executive Support: Leadership mandated UML modeling standards and provided training resources
-
Incremental Adoption: Started with Use Case and Class diagrams, gradually introducing more complex diagrams
-
Tool Integration: Visual Paradigm integrated with existing tools (JIRA, Git, Jenkins)
-
Living Documentation: Models were treated as living artifacts, updated with each sprint
-
Cross-Functional Training: Business analysts, developers, and QA all trained in reading UML diagrams
Challenges Overcome
Initial Resistance: Developers viewed modeling as overhead. Solution: Demonstrated time saved in debugging and clarified requirements.
Model-Code Drift: Diagrams became outdated. Solution: Integrated model validation into CI/CD pipeline.
Learning Curve: Team members struggled with UML syntax. Solution: Created cheat sheets and conducted pair modeling sessions.
Tool Costs: Visual Paradigm licensing expenses. Solution: ROI analysis showed 3x return through reduced defects and faster development.
AI-Powered UML Modeling: The Next Evolution
Visual Paradigm’s integration of AI into UML modeling represents a paradigm shift in software design.
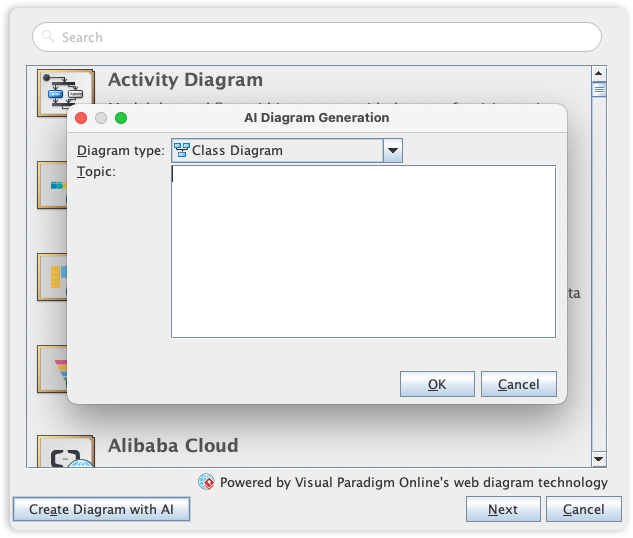
The AI Diagram Generator now supports 13 diagram types, enabling:
Rapid Prototyping: Text descriptions like “Create a banking system with customers, accounts, and transactions” automatically generate Use Case, Class, and Sequence diagrams
Intelligent Suggestions: AI analyzes requirements and suggests appropriate diagram types, relationships, and design patterns
Consistency Checking: AI validates models against UML standards and best practices
Natural Language to UML: Business stakeholders describe requirements in plain English, AI translates to formal UML models
Automated Refactoring: AI identifies design smells and suggests improvements
This AI integration allowed FinTech Solutions to reduce initial modeling time by 70%, enabling architects to focus on validation and refinement rather than manual diagram creation.
Best Practices for UML Implementation
Based on this case study, organizations implementing UML should:
-
Start with Business Value: Begin with Use Case and Activity diagrams to capture requirements before diving into technical details
-
Maintain Appropriate Abstraction: Use different diagram types for different audiences—executives see high-level Interaction Overview diagrams, developers see detailed Sequence and Class diagrams
-
Integrate with Agile: Update models incrementally each sprint; treat UML as agile documentation
-
Enforce Standards: Establish modeling conventions (naming, stereotypes, colors) across the organization
-
Leverage Tool Capabilities: Use Visual Paradigm’s features like model element referencing, code generation, and AI-powered tools
-
Balance Completeness and Pragmatism: Model what’s important; avoid over-modeling trivial components
-
Continuous Training: Regular workshops to maintain UML proficiency across teams
Conclusion
The successful modernization of FinTech Solutions Inc.’s digital banking platform demonstrates the transformative power of comprehensive UML modeling when applied systematically throughout the software development lifecycle. By leveraging all 14 types of UML diagrams available in Visual Paradigm, the organization achieved unprecedented alignment between business requirements, system architecture, and implementation.
The journey from initial requirements gathering with Use Case and Activity diagrams through detailed design with Class, Sequence, and State Machine diagrams to deployment planning with Component and Deployment diagrams created a cohesive visual language that bridged communication gaps between stakeholders. Advanced diagrams like Timing, Interaction Overview, and Profile diagrams addressed specialized needs for real-time performance, complex scenario coordination, and domain-specific extensions.
The integration of AI-powered diagram generation represents the next frontier in UML modeling, dramatically reducing the time from concept to validated design while maintaining the precision and clarity that makes UML invaluable. As software systems grow increasingly complex, the combination of human expertise and AI assistance in UML modeling will become essential for delivering high-quality systems on time and within budget.
Key takeaways from this case study include:
-
UML diagrams are not documentation overhead but essential design tools that prevent costly errors
-
Different diagram types serve different purposes and audiences; mastery of the full UML suite is crucial
-
Visual Paradigm’s comprehensive toolset supports the entire modeling lifecycle from requirements to deployment
-
AI integration accelerates modeling without sacrificing quality or precision
-
Model traceability through element referencing ensures compliance and facilitates maintenance
For organizations embarking on digital transformation initiatives, investing in UML modeling capabilities and tools like Visual Paradigm is not merely a technical decision but a strategic imperative. The ability to visualize, communicate, and validate complex system designs before implementation begins separates successful projects from failed ones. As demonstrated by FinTech Solutions Inc., the upfront investment in comprehensive UML modeling pays exponential dividends in reduced defects, faster development, improved stakeholder satisfaction, and ultimately, successful delivery of business value.
References
- Class Diagram: Comprehensive guide to modeling system structure through classes, attributes, methods, and relationships in object-oriented design
- Use Case Diagram: Guide to capturing functional requirements and user interactions from the actor’s perspective
- Sequence Diagram: Resource for modeling time-ordered interactions and message exchanges between objects
- Activity Diagram: Tutorial on representing flow of control and data for business process modeling
- State Machine Diagram: Guide to modeling object states, transitions, and event-driven behavior
- Component Diagram: Resource for visualizing software component organization and dependencies
- Deployment Diagram: Tutorial on modeling physical deployment of artifacts on hardware nodes
- Object Diagram: Guide to creating snapshots of object instances and their relationships at specific points in time
- Package Diagram: Resource for organizing classes into packages and managing large-scale system structure
- Composite Structure Diagram: Tutorial on modeling internal class structure and part interactions
- Interaction Overview Diagram: Guide to high-level interaction flow combining activity and sequence diagram elements
- Timing Diagram: Resource for modeling timing constraints and real-time system behavior
- Communication Diagram: Tutorial on emphasizing object relationships and message exchanges in runtime collaborations
- Profile Diagram: Guide to extending UML with custom stereotypes, tagged values, and constraints for domain-specific modeling