
Mastering MVC with UML: A Step-by-Step Guide to Sequence Diagrams
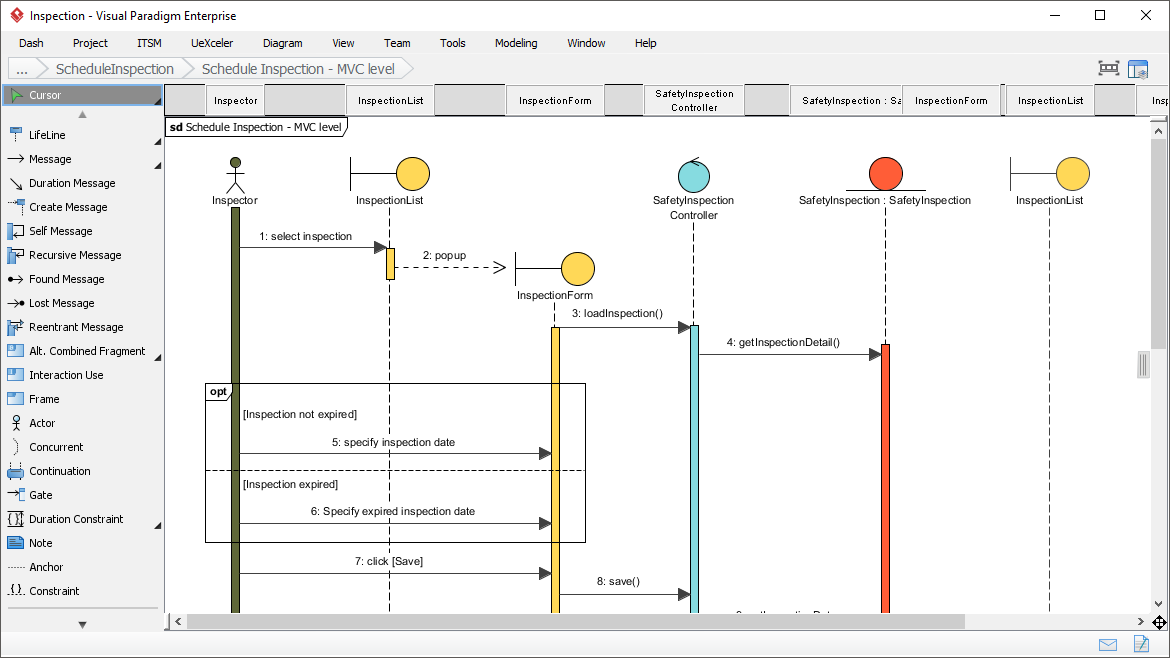
In the realm of software engineering, few things are as critical as understanding how a system behaves, not just what it is. While static diagrams like Class or Entity Relationship Diagrams (ERD) provide the skeletal structure of your application, Sequence Diagrams breathe life into that structure by visualizing interactions over time. This tutorial breaks down the complex “Schedule Inspection” workflow shown in the Visual Paradigm interface, demonstrating how to model the MVC (Model-View-Controller) pattern effectively.
What is a Sequence Diagram?
A Sequence Diagram is a type of interaction diagram because it shows how objects operate with one another or externally. The key differentiator here is the time dimension. Unlike other diagrams where position is arbitrary, a sequence diagram arranges objects vertically and messages horizontally from top to bottom, representing the chronological order of events.
Think of a sequence diagram as a script for a play. It tells you:
- Who is speaking (the Object or Actor).
- What they are saying (the Message/Method Call).
- When they say it (vertical positioning).
Deconstructing the “Schedule Inspection” Workflow
Let’s analyze the specific workflow depicted in the “Schedule Inspection – MVC level” diagram. This diagram illustrates a classic interaction between a User, a View, and a Controller.
1. The Actors and Objects
At the top of the diagram, you will see the Lifelines—vertical dashed lines representing the existence of an object over time. In this specific scenario, we have:
- Inspector (Actor): Represented by the stick figure, this is the human user initiating the process.
- InspectionList (Boundary): A control object responsible for displaying the list of available inspections.
- InspectionForm (Boundary): The view component where the user enters new data.
- SafetyInspection Controller (Control): The brain of the operation, handling business logic and coordinating the View and Model.
2. The Interaction Flow (Step-by-Step)
Follow the arrows to understand the sequence of logic:
- Initiation (Message 1): The Inspector clicks to “select inspection.” This triggers a message to the InspectionList.
- View Transition (Message 2): The InspectionList sends a “popup” message to open the InspectionForm. This is a critical visualization of the user interface flow.
- Controller Activation (Message 3): Upon opening, the InspectionForm asks the SafetyInspection Controller to “loadInspection().” The Controller becomes active (indicated by the activation bar), ready to fetch data.
- Data Retrieval (Message 4): The Controller requests specific data via “getInspectionDetail().” This implies a request to the Model (database) layer, even if the Model isn’t explicitly drawn as a lifeline here.
- Conditional Logic (The ‘opt’ Frame): This is the most complex part of the diagram. The diagram utilizes an Alternative (Alt) or Optional (opt) combined fragment (the box labeled “opt”).
- Condition A: If
[Inspection not expired], the user is asked to 5: specify inspection date. - Condition B: If
[Inspection expired], the user is asked to 6: specify expired inspection date.
This logic ensures the system handles different states gracefully.
- Condition A: If
- Finalization (Message 7 & 8): Once the date is specified, the user clicks Save. This triggers the InspectionForm to call the Controller’s save() method, committing the data.
Why This Matters for MVC Architecture
This diagram is a textbook example of the MVC (Model-View-Controller) pattern in action. By visualizing these interactions, you can spot potential architectural issues before writing a single line of code:
- Separation of Concerns: You can see clearly that the View (InspectionForm) does not handle logic directly. It delegates the “save” operation to the Controller.
- Decoupling: The Actor only interacts with the Boundary (View), not the Controller or Model directly. This keeps the system flexible.
- Complexity Management: The use of the “opt” frame allows you to model conditional logic (If/Else) without cluttering the diagram with separate paths.
Key Takeaways
Sequence diagrams are not just about drawing arrows; they are about defining the protocol of your application. By mastering the syntax of messages, lifelines, and combined fragments (like the “opt” frame used here), you can create a blueprint that developers and stakeholders alike can understand instantly.
Whether you are debugging a race condition or simply planning a new feature, the ability to visualize the “flow of control” is an indispensable skill for any software architect.